Division of Surface Science, Faculty of Chemical Technology and Engineering, Bydgoszcz University of Science and Technology, Al. Prof. S. Kaliskiego 7, 85-796 Bydgoszcz, Poland
Institute of Physics, Faculty of Physics, Astronomy and Informatics, Nicolaus Copernicus University in Toruń, ul. Grudziądzka 5, Toruń 87-100, Poland
Faculty of Chemistry, Nicolaus Copernicus University in Toruń, ul. Gagarina 7, Toruń 87-100, Poland
Department of Physics, Cracow University of Technology, ul. Podchorążych 1, 30-084 Kraków, Poland
Department of Physics, Kazimierz Wielki University in Bydgoszcz, ul. Powstańców Wielkopolskich 2, 85-090 Bydgoszcz, Poland
Bis(8-hydroxyquinoline) zinc dispersed in a poly(N-vinylcarbazole) matrix (Znq2:PVK) was characterised for its possible use as an active layer in organic light-emitting diodes. The composition and morphology of Znq2:PVK thin films deposited on quartz substrates was analysed by Fourier transform infrared spectroscopy (FTIR), scanning electron microscopy (SEM), and confocal microscopy. Optical properties of the films were characterised by absorption spectroscopy and photoluminescence and explained on the basis of calculated molecular properties of gas phase Znq2, N-vinylcarbazole pentamer, and molecular models for the Znq2:PVK interface. FTIR measurements of the Znq2:PVK film revealed the presence of water, likely due to the formation of Znq2-dihydrate during the fabrication process. Water could be removed by annealing films at 130 °C for 1 h and the annealed films showed better photoluminescence in the Znq2 emission region. Finally, two diodes with an ITO/PEDOT:PSS/Znq2:PVK/Al structure were fabricated, where in the second one, the ITO/PEDOT:PSS/Znq2:PVK layers were annealed at 130 °C. The first diode was characterised by a maximum brightness of about 83 cd/m2 and a current efficiency of 0.12 cd/A, while the diode whose structure was annealed had a maximum brightness of about 219 cd/m2 and a current efficiency of 0.26 cd/A.
Introduction
Bis(8-hydroxyquinoline) zinc (Znq2) is one of the metal che-lates Mqm (where m is the oxidation state of the metal – M) [1], which is a good candidate for improving the luminescent properties of organic light-emitting diodes (OLEDs) [2–7]. The Znq2 has better electron transport properties compared to Alq3 (tris(8-hydroxyquinoline) aluminium), resulting in lower operating voltages of the corresponding OLED devices [8]. Additionally, Znq2 has higher thermal stability compared to other transport layers [9], and Znq2-based OLEDs are relatively more stable under the influence of high operating voltages [10, 11]. That is, changing the operating voltage does not significantly affect their electroluminescence (EL) [8].
Znq2 can occur in two forms, each with distinct pro-perties. Under anhydrous conditions, it forms tetramers consisting of four Znq2 ((Znq2)4) molecules bridged by oxygen atoms [12, 13]. The planar structure of (Znq2)4 leads to a higher electron mobility, resulting in lower turn-on voltages in OLEDs mentioned above. Additionally, in presence of water, Znq2 can occur as a dihydrate containing two water molecules (Znq2⋅2H2O) aligned axially concern-ing the Zn atom with two hydroxyquinoline ligands in the plane [14]. The formation of the Znq2 dihydrate generally suppresses light emission and deteriorates device perfor-mance [15]. In contrast to the pure Znq2, which provides excellent electronic and optical properties, as well as good relative stability, the Znq2 dihydrate is not suitable for OLED applications.
Several groups have prepared OLEDs based on Znq2 in various device architectures, yielding signifi- cantly different OLED characteristics. Emission peaks at 556 nm were obtained for Znq2-based OLED structures such as ITO/PEDOT:PSS/PVK/Znq2/PBD/Al and ITO/PEDOT:PSS/PVK:Znq2:PBD/Al [16]. These were shown to have lower turn-on voltages and higher current densities compared to Alq3 OLEDs in the same configuration [16]. Others obtained emission peaks at 530 nm (ITO/Znq2:PVK/Al) [12], or 540 nm (ITO/PEDOT:PSS/NPB/Znq2/BCP/LiF/Al) [17]. The max-imum measured brightness of these different OLEDs also varied drastically. A maximum brightness of 791 cd/m2 was obtained by Rawat et al. for ITO/PEDOT:PSS/NPB/Znq2/BCP/LiF/Al [17], while a brightness of 3000 cd/m2 was noticed by Lim et al. for an OLED with an ITO/TPD:PMDA-ODA PI/Znq2/Al structure [18]. The highest brightness ever obtained for Znq2-based devices was 16 200 cd/m², achieved by Sano et al. for ITO/TPD/Znq2/Al [19]. These large variations in brightness may likely be related to the differences in properties between Znq2-dihydrate and pure Znq2.
This work aims to present the optical and structural properties of a bis(8-hydroxyquinoline) zinc poly(N-vinyl-carbazole) (Znq2:PVK) thin film, deposited on quartz substrates by spin-coating, using Fourier transform infrared spectroscopy (FTIR), scanning electron microscopy (SEM), confocal microscopy (CM), ultraviolet-visible (UV-Vis), and photoluminescence (PL). Using FTIR spectroscopy, the authors show that the thin films contain water, probably due to the formation of Znq2-dihydrate. Annealing these films at 130 °C for 1 h should result in the removal of water and the formation of Znq2 tetramers. This hypothesis is confirmed by PL measurements and UV-Vis absorption spectroscopy combined with time-dependent density functional theory calculations for the gas-phase Znq2, Znq2‑dihydrate, Znq2 tetramers, PVK, and Znq2:PVK model systems. The authors has also prepared a simple OLED structure (i.e., ITO/PEDOT:PSS/Znq2:PVK/Al) which, to the best of their knowledge, is the first such structure with Znq2:PVK as an active layer.
Materials and methods
Materials
Znq2 and poly N-vinylcarbazole (PVK, Mw ~1 000 000 g/mol) powders were purchased from Sigma-Aldrich. The mole-cular structures of Znq2 and PVK are presented in Fig. 1(a).
Fig. 1. (a) OLED structure with Znq2 and PVK molecular structures (ITO(L = 118,35 nm)/PEDOT:PSS(L = 60 nm)/Znq2:PVK(L = 109,90 nm)/Al(L = 103 nm)) and (b) its energy levels.
Thin films preparation
To obtain a Znq2:PVK thin layer on a quartz substrate by spin-coating (Spin coater Laurell, 1600 rpm), PVK was first dissolved in dichloroethane (for HPLC ≥ 99.8%, Sigma Aldrich), and after 24 h, 20 mg of Znq2 powder was added. This mixture was then placed in an ultrasonic bath for approximately 30 min before being deposited on a clean substrate [20]. Additionally, a Znq2:PVK thin layer was annealed for one hour at 130 °C in a muffle furnace.
Experimental methods
FTIR spectra of Znq2:PVK thin films before and after annealing at 130 °C were measured using an FT-IR Vertex 70 V with a Hyperion 1000/2000 microscope from Bruker Optik in the range of 200–1800 cm-1. SEM measurements were performed with a Quanta 3D FEG (EHT = 30 kV) instrument. Confocal microscopy measurements were performed using a Lext Olympus OLS 4000 device with a 405 nm laser. In this article, 20× magnification was used, and the imaged area size was 645 × 645 μm2. UV-Vis measurements of Znq2:PVK thin films deposited on quartz substrates before and after annealing at 130 °C were measured at room temperature using a Specord 200 spectrometer in the range of 270–600 nm. The PL signal of Znq2:PVK thin films before and after heating was registered using an FS5 spectrofluorometer.
OLED
The procedure for fabricating the following ITO/PEDOT:PSS/Znq2:PVK/Al OLED structure [see Fig. 1(a)] is described elsewhere [20]. The energy band diagram of the prepared OLED is shown in Fig. 1(b). In this structure, a glass substrate is used as a support for the OLED. Transparent indium tin oxide (ITO) serves as an anode, providing light transmission. When a voltage is applied to the OLED electrodes, holes are transported from the ITO and injected into the Znq2:PVK emitting layer via PEDOT:PSS, a layer that facilitates the injection of holes from ITO into Znq2:PVK. At the same time, electrons are transported from the cathode (Al) and injected into the emitting layer. As a result, electron-hole pairs recombine in Znq2:PVK and light is emitted as long as current flows.
Theoretical calculations
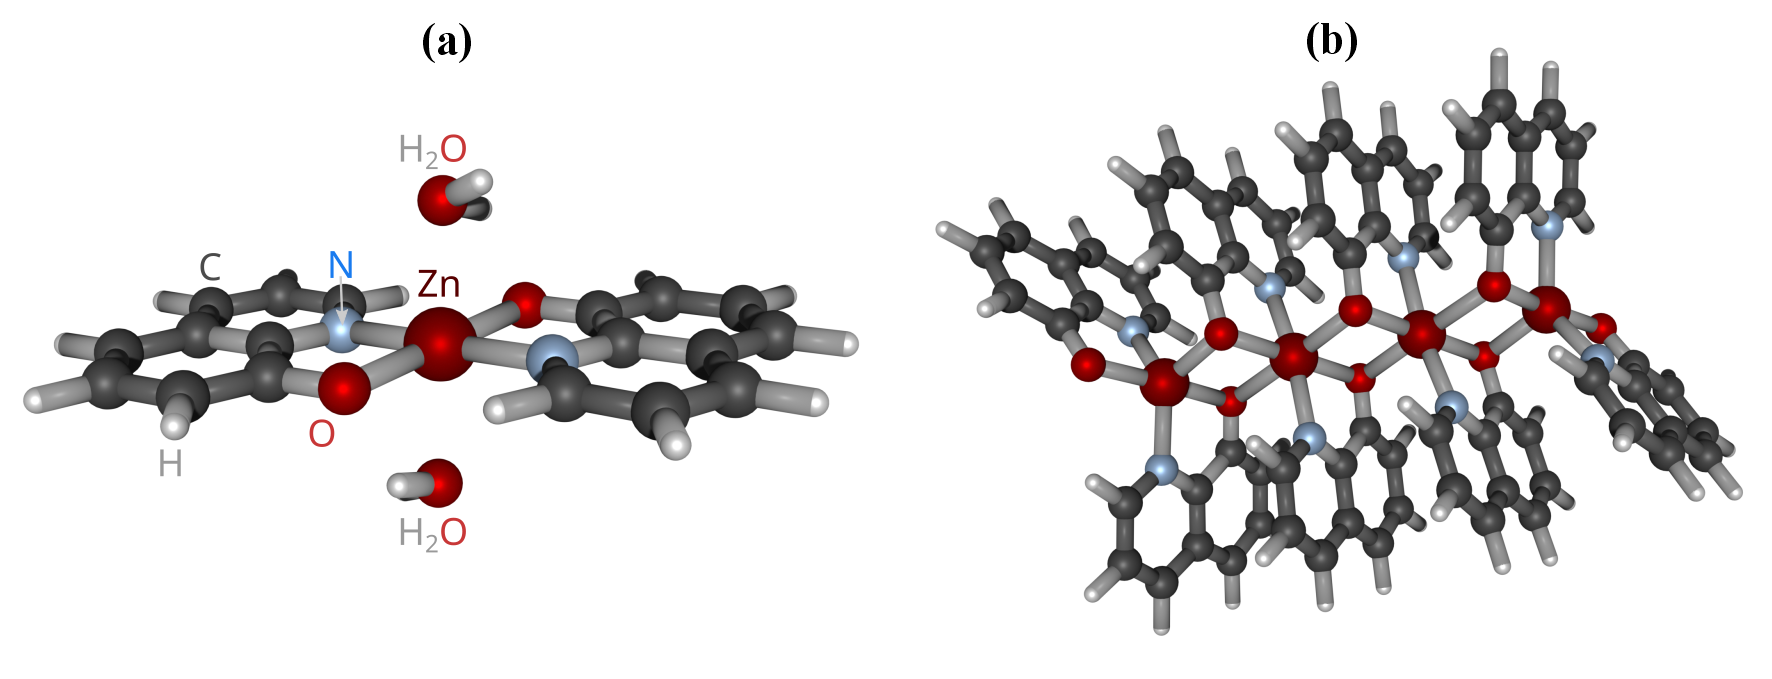
The molecular structures of Znq2, Znq2-dihydrate (Znq2⋅2H2O), and the Znq2 tetramer ((Znq2)4) were optimized in Gaussian16 [21] at the density functional theory (DFT) level using the ωB97X-D functional [22] in combination with the def2-SVP basis set [23].
The stable conformations of the Znq2:PVK models were determined with the introductory metadynamics run with the XTB program by Grimme [24]. The geometry of the resulting structures was reoptimized with the ωB97X-D/def2-SVP approach and the character of the stationary points was confirmed with a harmonic vibrational analysis (see Fig. 2). The structures exhibiting relative energies below 3 kcal/mol were investigated, since they may be important components of the reaction mixture under standard conditions. However, the final calculations were carried out only for the most stable configurations, since the structures, interaction energy, and photophysical properties were similar for all these molecular systems. The vertical absorption was investigated within time-dependent (TD)-DFT with the ωB97X-D functional [22]. This choice of a functional is dictated by its confirmed general good performance both for structure and excitation energy in the case of organic dyes. The long-range corrected ωB97X-D functional, combined with the empirical Grimme disper-sion correction, ensures a good balance between the computational cost and quality of calculations for the polymer models investigated here. The energies of frontier orbitals were also predicted using the HSE06 functional to maintain consistency with the authors’ previous work on the Alq3:PVK systems [20]. To deeply analyse the charac-ter of the excitations, Le Baher’s charge transfer indexes were calculated [25]. The supermolecular interaction energy with the counterpoise correction was estimated within the ωB97X-D/def2-SVP approach. All DFT calculations were carried out with the Gaussian16 program [21] and non-covalent interactions were depicted with NCIPlot [26–28].
Fig. 2. Optimized geometry of (a) Znq2⋅2H2O and (b) (Znq2)4.
Results and discussion
The absorption spectra of Znq2:PVK thin films deposited on a quartz substrate before and after annealing at 130 °C are shown in Fig. 3(a). It can be observed that for Znq2:PVK thin layers, there are three absorption bands. The first one, located at 294 nm, is assigned to the optical transitions of carbazole units of PVK [29]. The band at 334 nm (before annealing) is assigned to a π–π* excitation of the 8-hydroxyquinoline unit, while the band at 344 nm (before annealing) is also an excitation of π–π* character, but involving two other π orbitals of the 8-hydroxy-quinoline unit [30, 31] [the natural transition orbitals (NTOs) and related discussion is below and in SI]. A slight shift of these bands to 330 nm, respectively 343 nm, is observed after annealing.
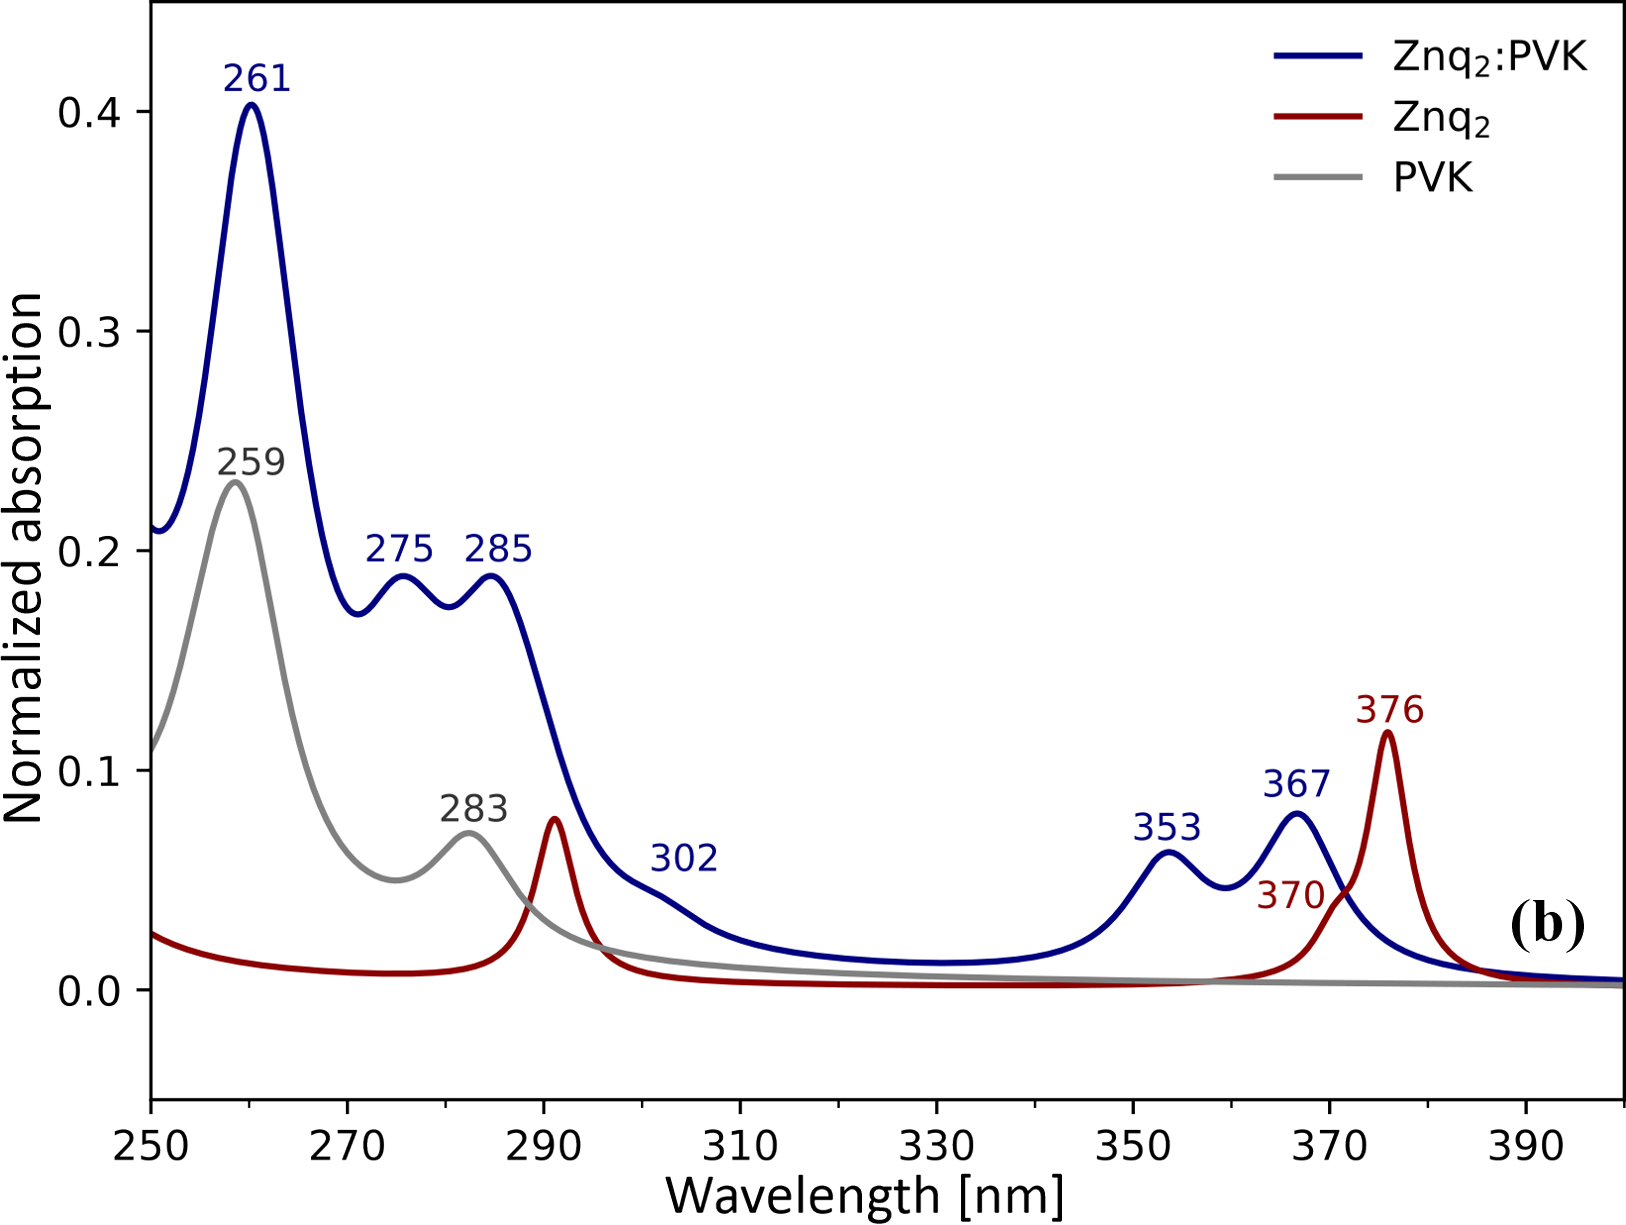
Fig. 3. (a) Absorption spectra of Znq2:PVK thin films before
and after annealing at 130 °C. (b) Vertical absorption
spectrum for Znq2 (red line), PVK model (grey line),
and Znq2:PVK (blue line) estimated with the TD-
ωB97X-D/def2-SVP approach. See also
Fig. S2
in the
Supporting Information (SI).
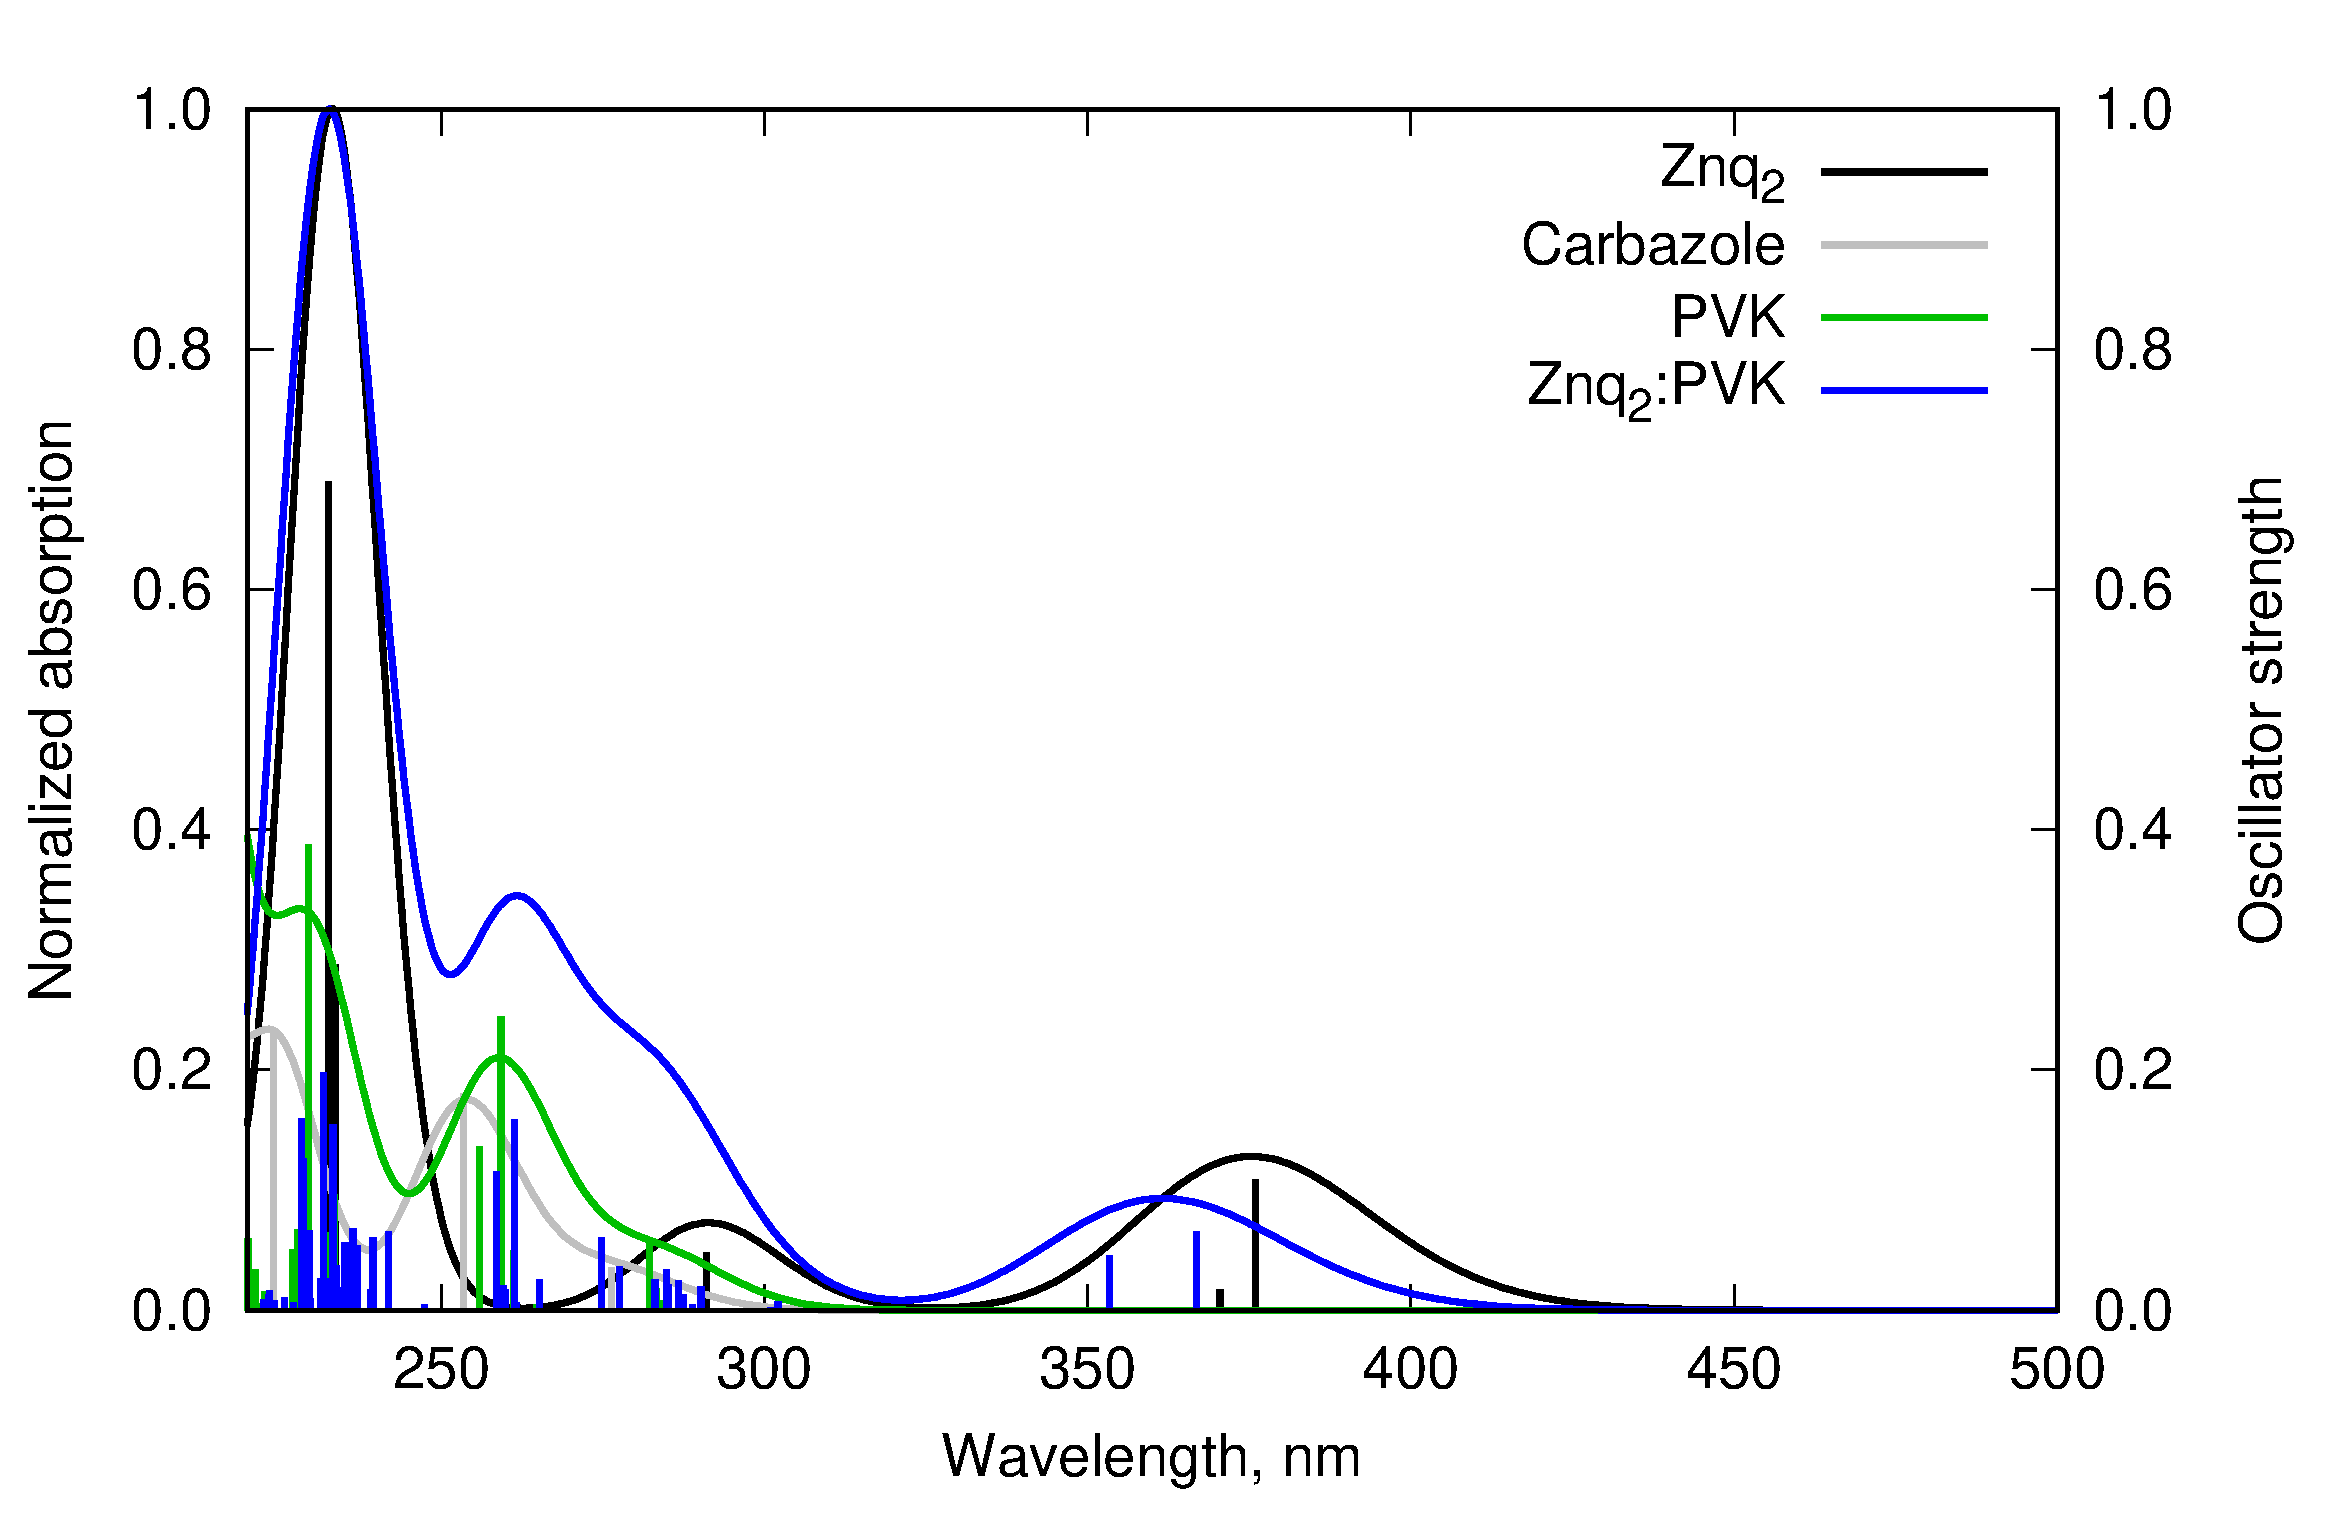
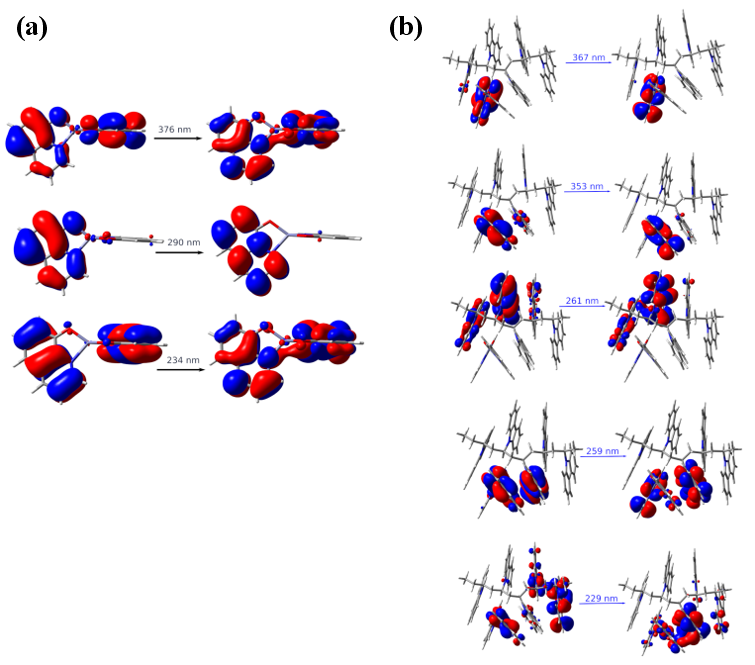
The vertical absorption spectrum for a single Znq2 molecule in vacuum and for a Znq2:PVK model, calculated within the TD-ωB97X-D/def2-SVP approach, is presented in Fig. S2. The lowest energy bands at 376 nm and 370 nm in bare Znq2 become shifted hypsochromically by about 10–20 nm upon interaction with PVK. These calculated peaks for the Znq2:PVK model system correspond to the absorption bands measured experimentally at 343 nm and 330 nm (after annealing). It is worth noting that the authors’ theoretical model is limited to one Znq2 molecule relaxed in the vicinity of a PVK oligomer containing five repeated monomer units. The shifts (of about 20–25 nm, or 0.15–0.4 eV) observed between the calculated and meas-ured bands are of the same order of magnitude as the accuracy of the TD-DFT approach using ωB97X-D functional [32] and are reasonable considering the limited molecular model used to represent the Znq2:PVK interface. The corresponding natural transition orbitals of Znq2, depicted in panel Fig. S3(a), reveal that the character of these transitions is π→π* with the corresponding electron density concentrated at the 8-hydroxyquinoline moiety.
The wavelength region between 250 nm and 300 nm is somewhat more complicated, as transitions can be observed involving charge transfer between Znq2 and a polymer chain (see NTOs in Fig. S3 in the SI). However, the strong band calculated at 261 nm can be attributed mainly to the polymer, as indicated by the NTOs depicted in Fig. S3. Considering the accuracy of the authors’ theoretical model, the bands calculated in the 250–300 nm region can be assigned to the measured band centred at 294 nm.
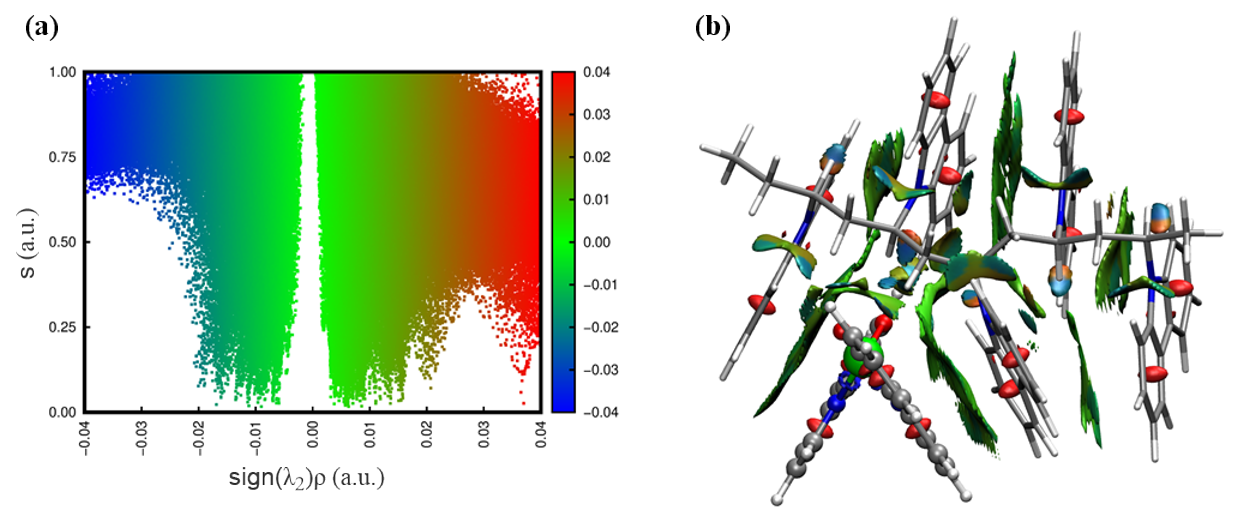
The structure of the Znq2:PVK model obtained within DFT approach indicates strong π-π stacking between the 8‑hydroxyquinoline moiety of Znq2 and carbazole rings in the polymer chain (see Fig. 4). The Znq2 molecule fits well between aromatic side substituents of the polymer to maximize the mutual attraction. For the model polymer chain and Znq2, the counterpoise-corrected supermolecular interaction energy is equal to −35.78 kcal/mol in the case of the most stable configuration. This is more than 5 kcal/mol stronger than an interaction observed for the similar Alq3:PVK interface [20], where a similar arrangement leads to an interaction energy equal to −23.29 kcal/mol for the mer-Alq3:PVK complex. This enhancement of the attraction arises from better compatibility of the Znq2 shape to the arrangement of carbazole aromatic units in the polymer chain than that observed for the three perpendicular hydroxyquinoline modules in Alq3.
Fig. 4. (a) NCIPlot weak interaction analysis with colour-coding blue for strong attractive interactions, green for weak van der Waals interactions, and red for repulsion; (b) lowest energy configuration of Znq2:PVK complex optimized within the ωB97X-D/def2-SVP approach together with the surfaces indicating the intramolecular and intermole-cular interactions, according to NCIPlot (polymer chain presented as licorice and Znq2 molecule – in CPK repre-sentation; green isosurfaces indicate weak van der Waals interactions).
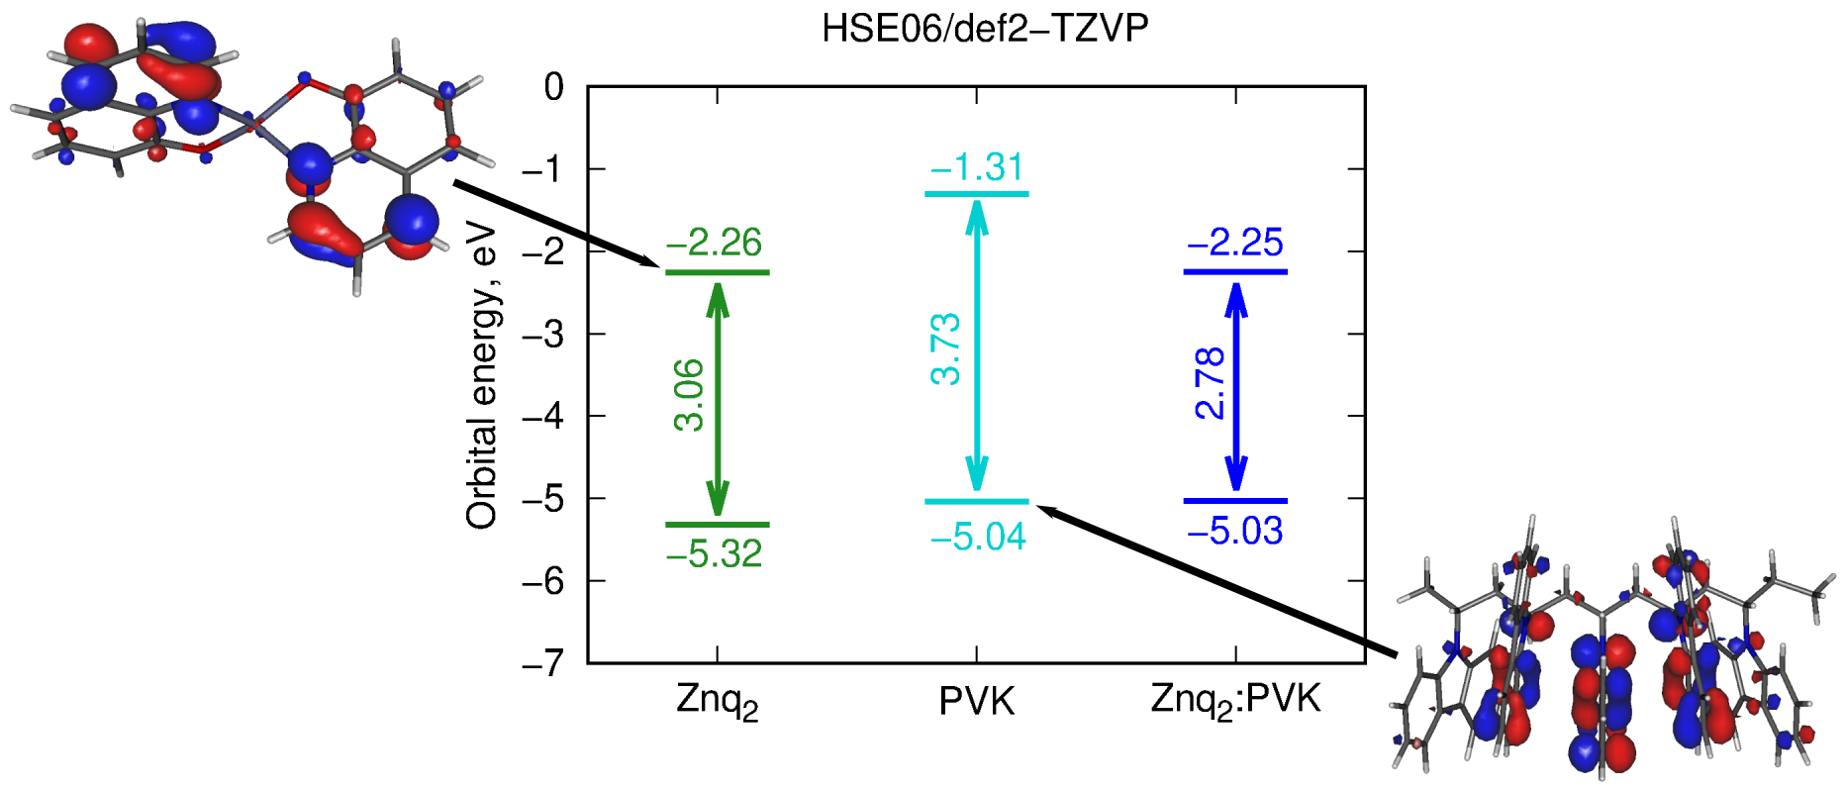
Theoretical values of HOMO and LUMO energies for model PVK, Znq2, and the Znq2:PVK system are presented in Fig. 5 together with the shape of the corresponding orbitals. The comparison with the Alq3:PVK [20] material shows an even better match between the polymer HOMO energy and Znq2 LUMO energy, which is slightly lowered with respect to the isolated Alq3 LUMO level.
Fig. 5. Orbital energy levels for HOMO and LUMO orbitals
of Znq2, PVK, and Znq2:PVK estimated with
HSE06/def2-TZVP.
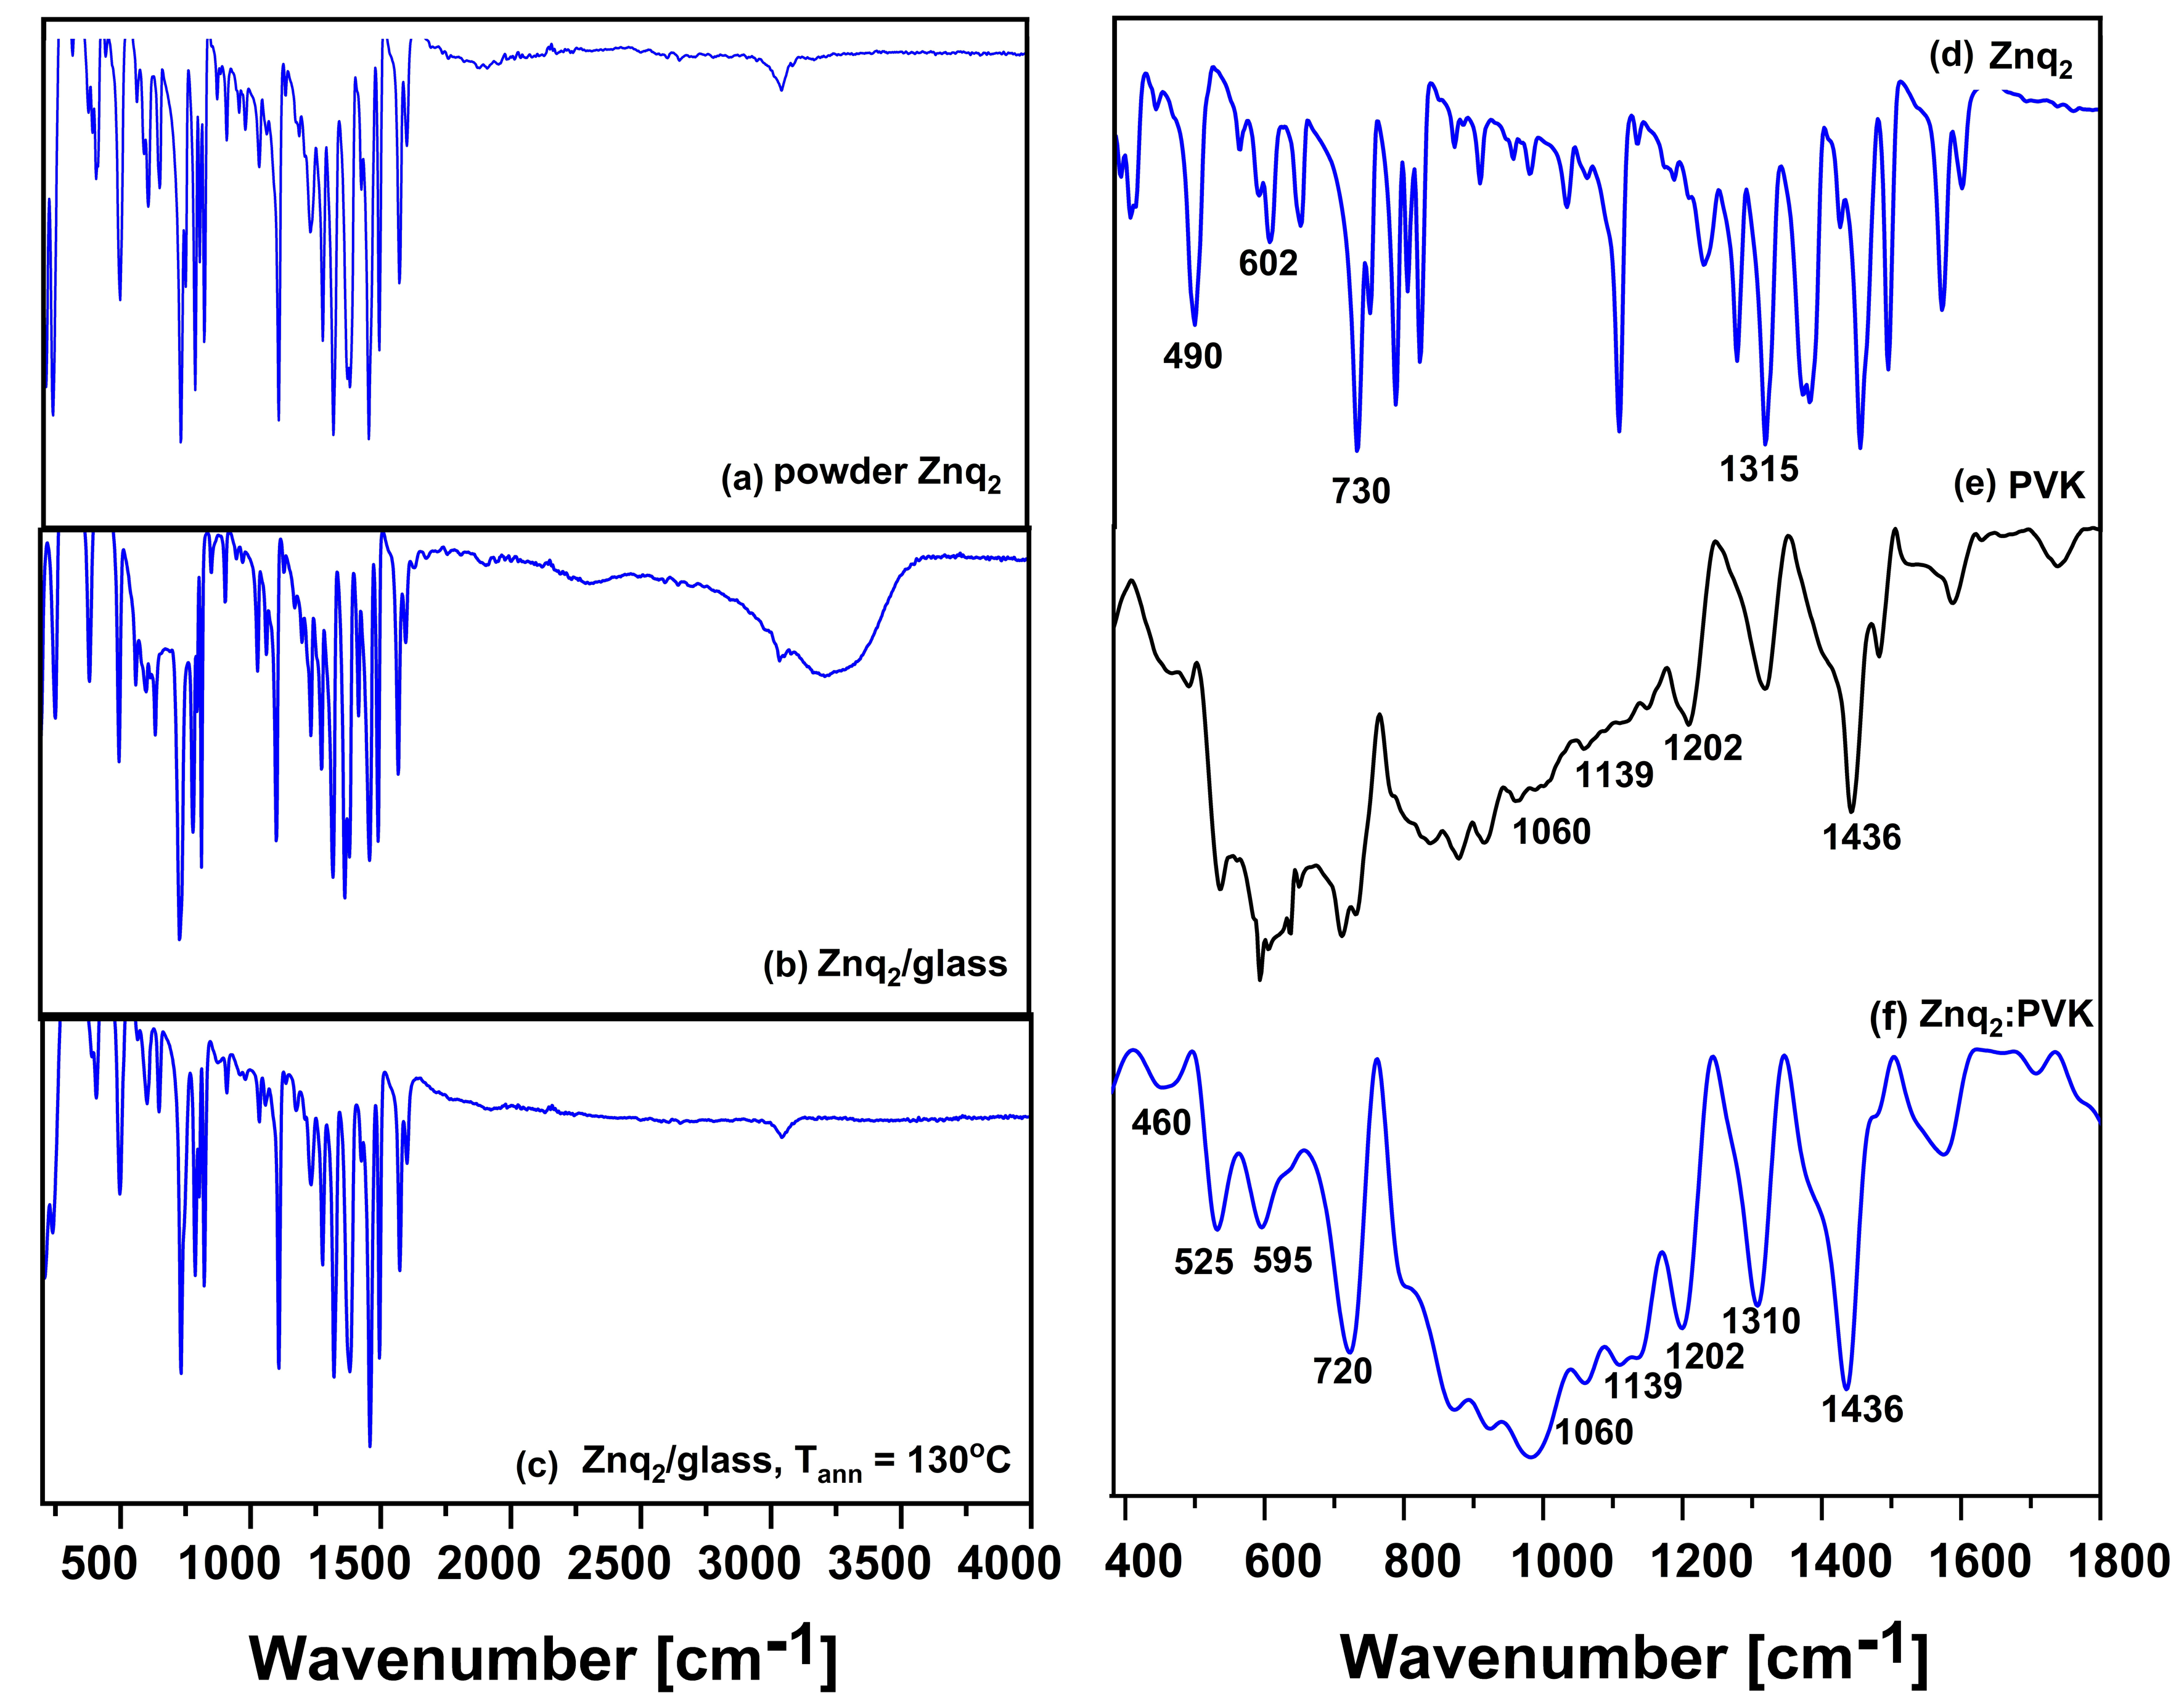
The FTIR spectrum was recorded for the purchased Znq2 powder to determine its crystalline form. The spectrum shown in Fig. 6(a) clearly indicates that the compound exists in the anhydrous form. The FTIR spectrum for the dihydrate phase would have an additional broad band at 3200 cm-1, which is not visible in this spectrum. FTIR spectra were measured for Znq2 films obtained by spin-coating after the solvent (dichloroethane) was allowed to evaporate. In the case of the layer deposited on the substrate without any subsequent thermal treatment [see Fig. 6(b)], Znq2 occurred in a dihydrate form (Znq2⋅2H2O), as evidenced by the presence of a broad O–H band appearing in the range of 3000–3300 cm-1. The sample was then annealed at 130 °C. This temperature was selected to achieve a phase transition from Znq2⋅2H2O dihydrate to anhydrous (Znq2)4 [15]. FTIR measurements were repeated for the layer after annealing at 130 °C [see Fig. 6(c)], and anhydrous Znq2 was obtained, similarly to the starting powder used to prepare the deposition mixture [Fig. 6(a)]. Figures 6(e) and 6(f) show the FTIR spectra of PVK and Znq2:PVK thin films in the range of 400–1800 cm-1. The peaks at 400–600 cm-1 are assigned to Zn–O and Zn–N stretching vibrations, while the peaks at about 595 and 720 cm-1 are assigned to in-plane ring deformations [33]. Characteristic bands appear for the PVK polymer at: 1060 cm-1, 1139 cm-1, 1202 cm-1, and 1436 cm-1 [34]. The vibrations at 1310 cm-1 are assigned instead to the quinoline group of Znq2 [35].
Fig. 6. FTIR spectra for powder of (a) Znq2 and (b) thin
films of Znq2 on glass before and (c) after annealing
at 130 °C, and (d) layers of Znq2, (e) PVK, and
(f) Znq2:PVK.
Comparing PVK to Znq2:PVK, it can be seen that the FTIR bands corresponding to the polymer are located at the same wavenumbers in both samples. However, comparing Znq2 to Znq2:PVK, shifts are observed for some of the bands. In the case of the bands in the range of 400–600 cm-1 associated with Zn–O and Zn–N stretching vibrations, they become weaker after the formation of the Znq2:PVK struc-ture. The Znq2 band at 730 cm-1, corresponding to in‑plane ring deformations, is shifted to 720 cm-1 in Znq2:PVK. Similarly, the Znq2 band at 1315 cm-1, assigned to vibrations of the quinoline group, is shifted to 1310 cm-1 in the Znq2:PVK sample.
Bakhshipour et al. [36] studied Znq2 annealed at temperatures of 50, 100, 150, and 200 °C. They observed a transition from (Znq2) ⋅2H2O to (Znq2)4 at higher annealing temperatures based on the disappearance of the O-H band at 3400 cm-1. Painuly et al. [15] observed a change from (Znq2) 2H2O to (Znq2)4 after annealing in argon for 3 h at 200 °C, while Hu et al. [37] showed that the transition from dihydrate to anhydrous Znq2 began at 135 °C in vacuum.
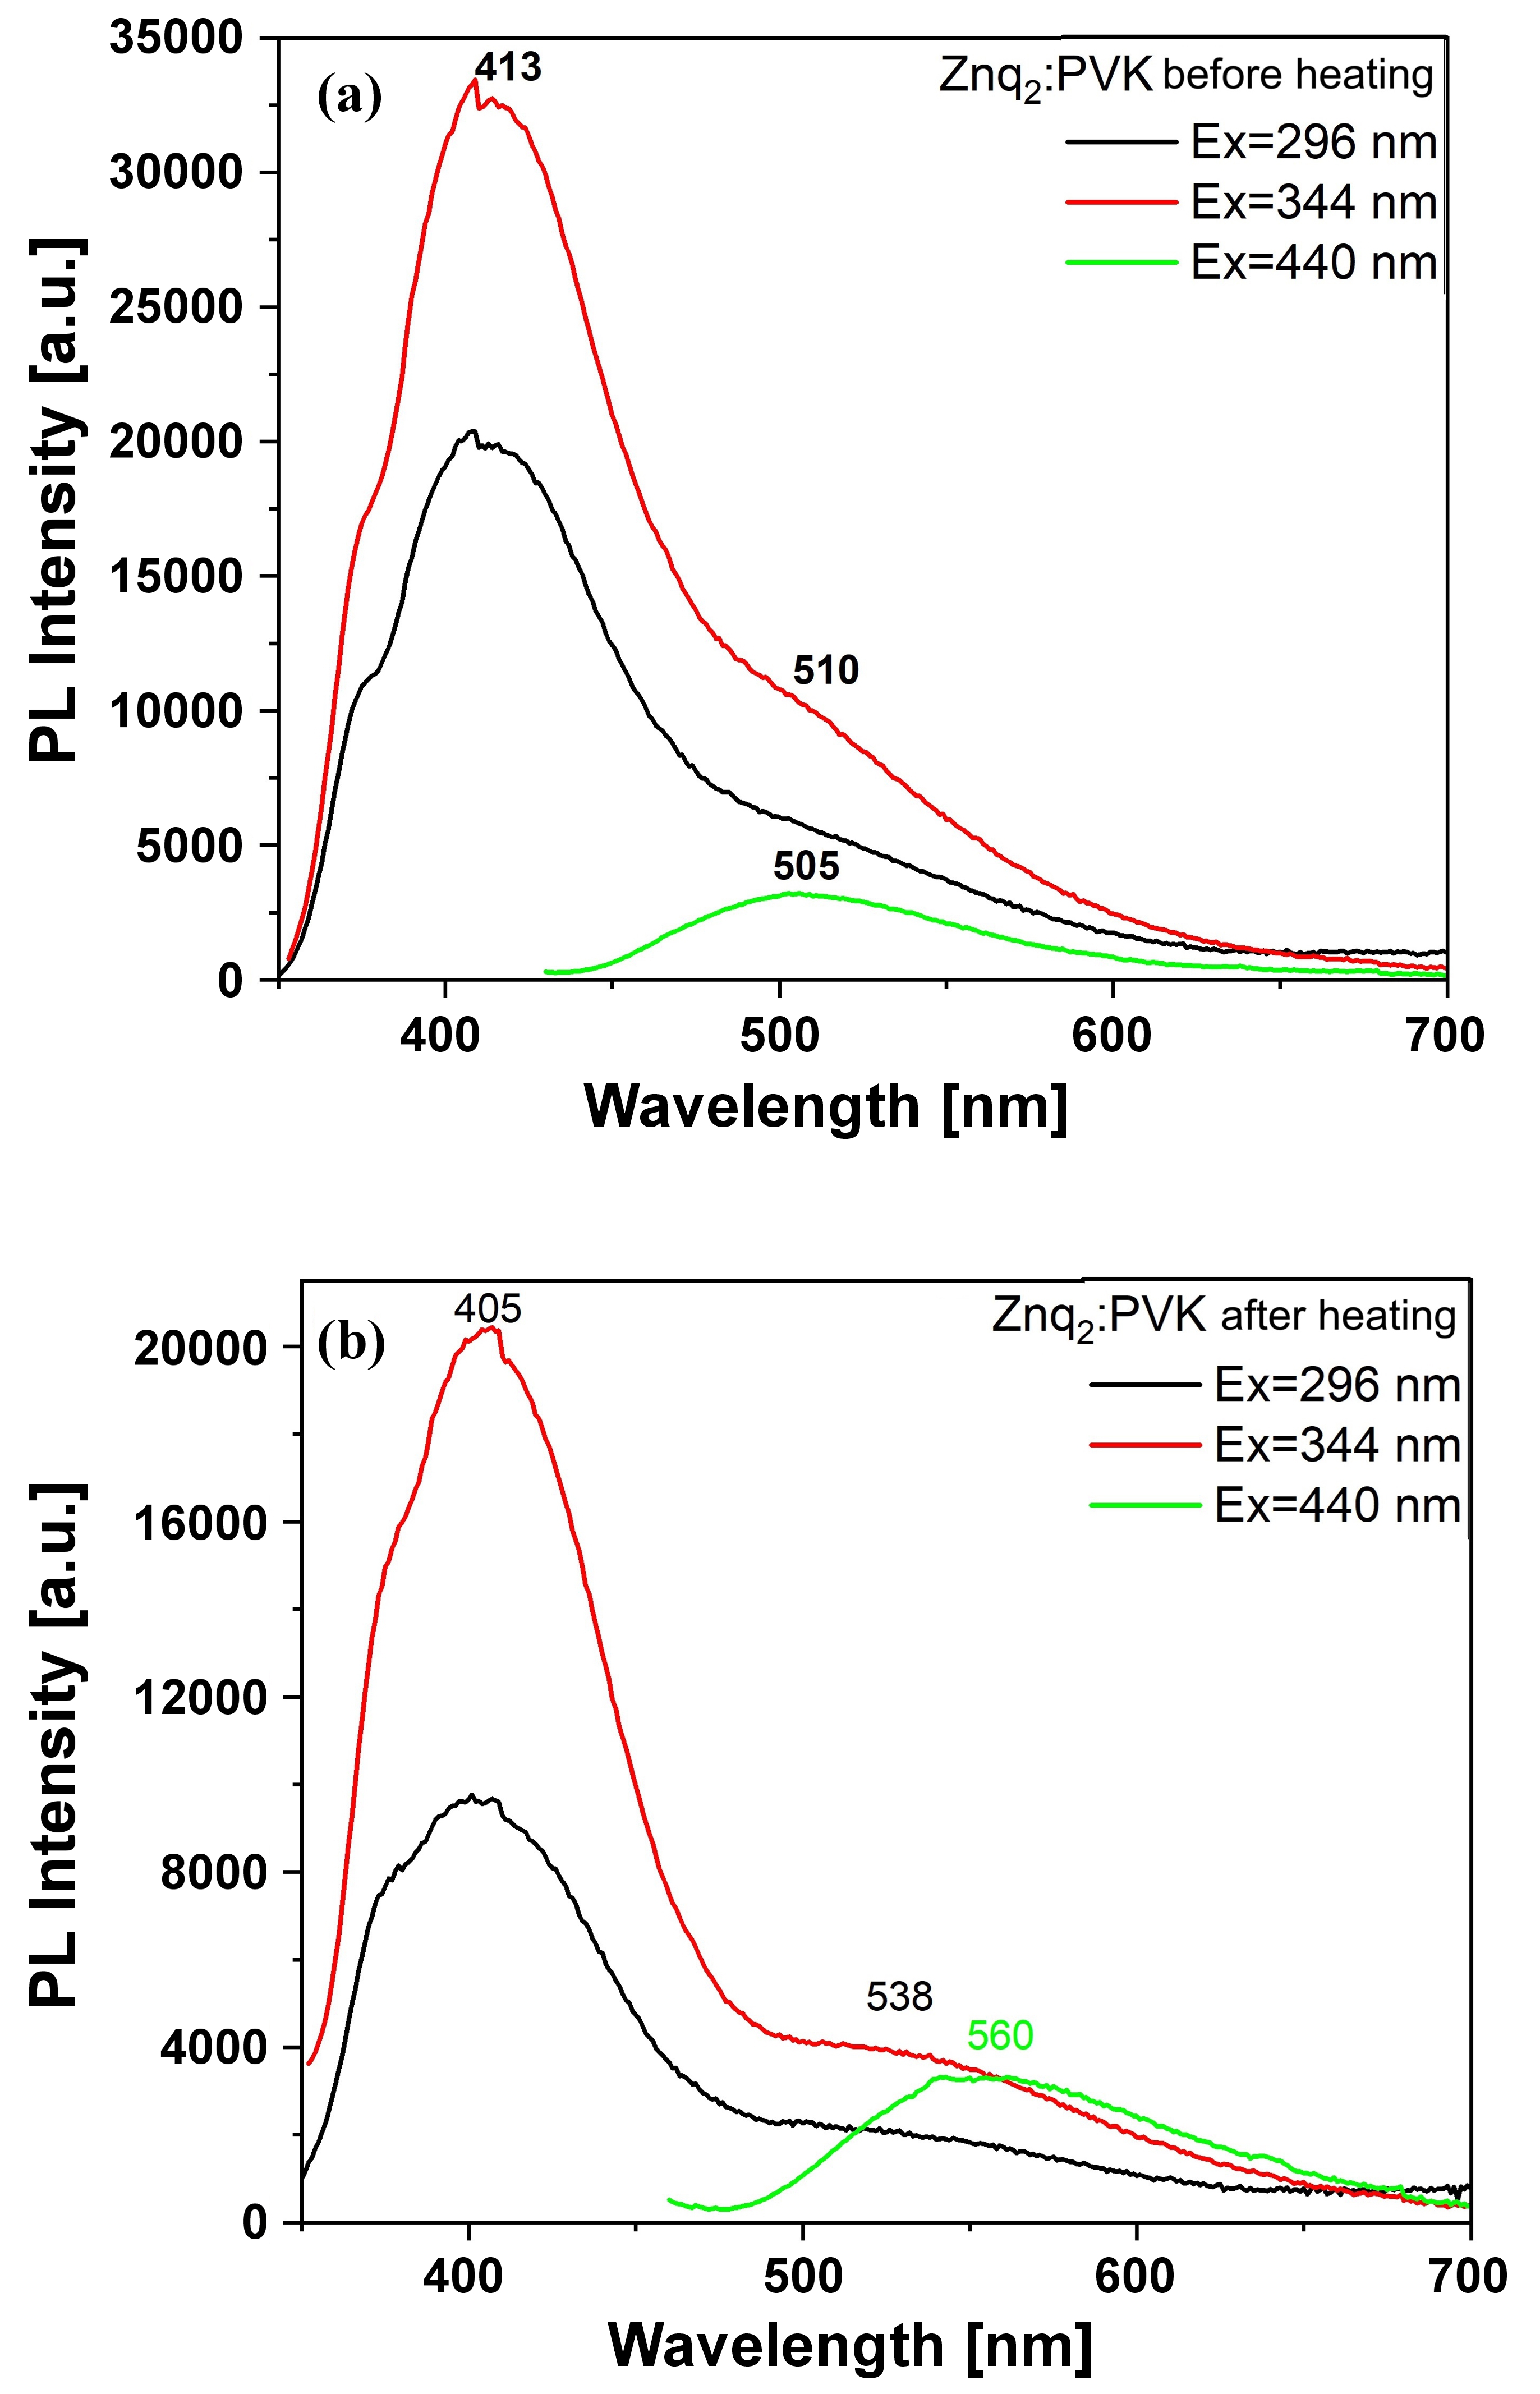
Fig. 7 shows the PL spectra of Znq2:PVK thin films on a quartz substrate before and after annealing at 130 °C for three different excitation wavelengths: 296 nm, 344 nm, and 440 nm. Two distinct peaks are visible in the spectra. The first peak for the unannealed sample, appearing at 413 nm, corresponds to PVK and is related to intrachain excimers comprising different configurations of two adjacent carbazole groups [38]. These excimers arise from the interaction between excited states of neighbouring carbazole units, resulting in a characteristic emission wavelength. The formation and stability of these excimers are influenced by the polymer matrix and the spatial arrangement of the carbazole units. The second peak, observed in the sample before annealing, is in the range of 505–510 nm and corresponds to Znq2. This peak is attributed to the electron intraligand charge transfer (ILCT) transition within the Znq2. The electron transitions are π-π* and are related to the S1→S0 transitions of the Znq2 [3]. The ILCT transition involves the transfer of an electron from a ligand-centred orbital to another ligand-centred orbital, which is influenced by the molecular structure and the surrounding matrix.
Fig. 7. PL spectra of thin film of Znq2 dispersed in PVK
matrices (a) before and (b) after annealing at 130 °C.
Upon annealing, the spectra reveal significant changes. The peaks shift to 405 nm for PVK and to 538 nm for excitations at 296 and 344 nm, and to 560 nm for excitation at 440 nm for Znq2. These shifts can be explained by the structural changes induced by heating. Before annealing, the films contain the Znq2⋅2H2O form in which water molecules are loosely bound to the zinc atom. Heating to 130 °C removes these water molecules, leading to the formation of an anhydrous Znq2, which tends to form a tetrameric structure (Znq2)4. This structural transformation alters the electronic environment of the Znq2 molecules, leading to distinct emission properties.
In the work of Hopkins et al. [12], the PL results for Znq2 and Znq2 dispersed in a PVK polymer matrix were compared. They found that the maximum PL peak for Znq2 was at 542 nm, while in the PVK matrix, the PL spectrum maximum shifted to 528 nm. This shift is consistent with the electron-withdrawing nature of the sulphonamide substituent. The presence of the PVK matrix affects the electronic interactions within the Znq2, leading to a shift in the emission wavelength.
Additionally, it is noteworthy that the highest spectral intensity was achieved at an excitation wavelength of 296 nm which decreases as the excitation wavelength increases. This variation can be attributed to the excitation efficiency and the overlap between the excitation wave-length and the absorption spectrum of the material. As the excitation wavelength increases, the overlap decreases, resulting in lower PL intensity. Moreover, an increase in the excitation value results in a shift of the PL peak. This phenomenon of shifting PL maxima with changes in excitation wavelength is characteristic of metalloquinolines. This behaviour is based on the coupling of vibrations of individual ligands with fluorescence transitions [39, 40]. The vibrational states of ligands can interact with electronic transitions, leading to a shift in the emission wavelength. Metalloquinoline molecules possess a specific geometric configuration and uniform energy levels which can restrict their vibrational freedom. During excitation, only molecules with energy levels corresponding to the excitation wave-length are excited, resulting in the observed shift of the PL peak [41].
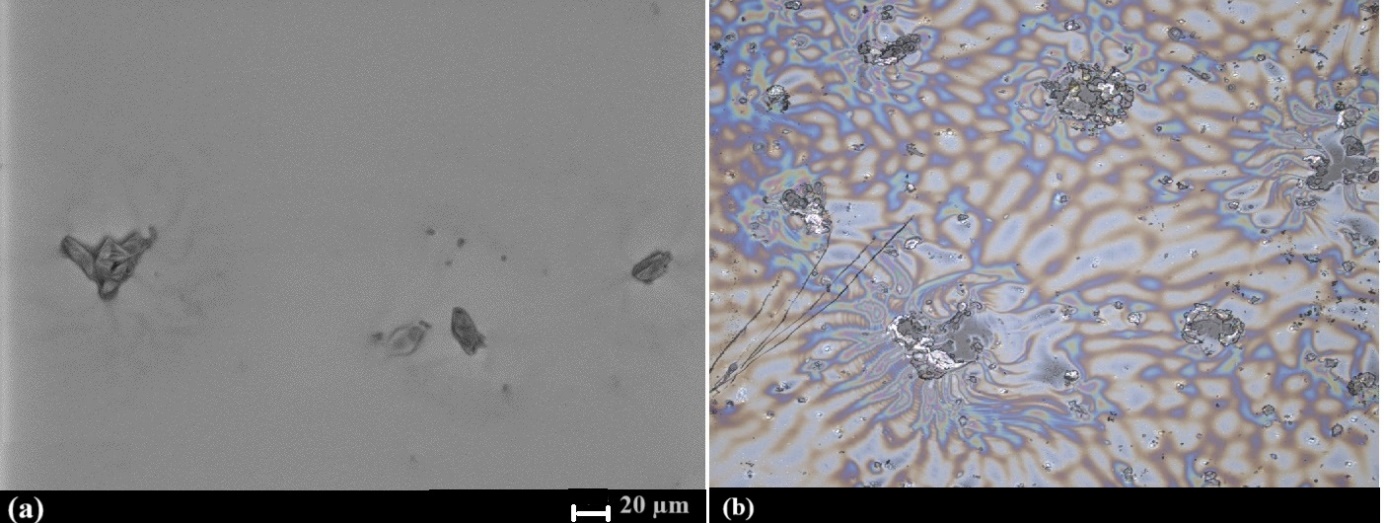
SEM and confocal microscopy image analyses for the Znq2:PVK sample are shown in Figs. 8(a) and 8(b). SEM measurement reveals that the obtained thin layer is relatively smooth, with some agglomerates present. The aggregation of Znq₂ may be attributed to intermolecular interactions such as π–π stacking, C–H···O hydrogen bonding, and C–H···π interactions between the molecules [35]. The sizes of such agglomerates range from 20 to 50 μm. Fig. 8(b) shows that the polymer layer is inhomogeneous near the agglomerates. In addition to the agglomerates, smaller Znq2 grains are visible.
Fig. 8. SEM image of the Znq2:PVK surface (a) at magnification
500x; (b) confocal microscope photo at magnification
20x; image size 645 × 645 μm2.
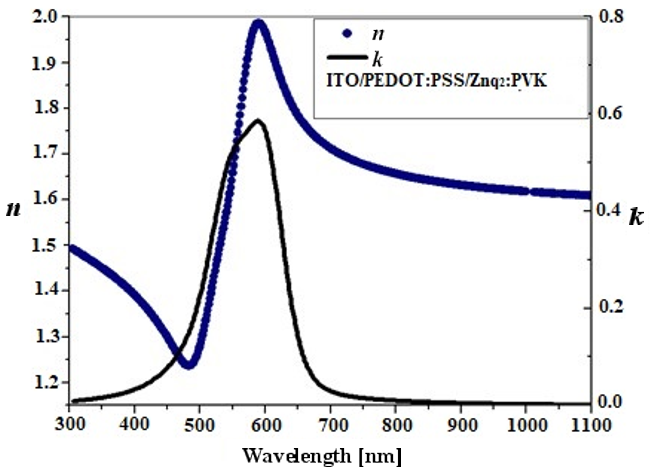
The refractive index (n) and extinction coefficient (k) obtained from spectroscopic ellipsometry measurements for the OLED structure studied in this work are shown in Fig. 9. The results are similar to those presented by the authors in [42] for the Znq2 derivative with a styryl group. The angles Δ and Ψ obtained experimentally and measured for different illumination angles ranging from 60° to 70°, are presented in Fig. S4.
Fig. 9. Dependence of n and k for the unannealed Znq2:PVK layer on a PEDOT:PSS/ITO/glass substrate
Fig. 10(a) and 10(b) show the current density-voltage and the EL-voltage curves, respectively. Fig. 10(a) shows the current-voltage characteristics of the studied OLED before and after annealing the Znq2:PVK layer. The threshold voltage UT was 8.94 V and 9.36 V for the diode before and after annealing the Znq2:PVK film at 130 °C, respectively. The EL-voltage characteristics presented in Fig. 10(b) show typical features of EL devices. The tested OLED before annealing exhibits a maximum brightness value of approximately 83 cd/m² with a current efficiency of 0.12 cd/A. In the case of the diode in which the Znq2:PVK film was annealed, the maximum brightness value of about 219 cd/m2 was obtained with a current efficiency of 0.26 cd/A. The presence of water in the diode before annealing may be responsible for the low parameters of the OLED. It can be seen that after annealing, the maximum brightness value increased more than twice, which may confirm this thesis.
Fig. 10. (a) Current density-voltage curves and (b) EL‑voltage characteristics for structure ITO/PEDOT:PSS/Znq2: PVK/Al, where Znq2:PVK was not annealed and after being annealed.
The diode obtained is weaker than the Znq2 diodes described by other authors. This may be due to a different method of depositing the Znq2 layer, as well as the presence of additional layers that have not been included which may support carrier transfer in the diode, leading to better parameters. Rawat et al. described an OLED with an ITO/PEDOT structure: PSS (40 nm)/NPB (20 nm)/Znq2 (50 nm)/BCP (7 nm)/LiF (0.8 nm)/Al (200 nm), where the active layer was deposited in high vacuum [17]. The diode they obtained was characterised by maximum EL at a wavelength of 540 nm with a maximum current efficiency of 0.64 cd/A and a maximum brightness of 791 cd/m2. Sano et al. [19] prepared an OLED with an ITO/TPD (50 nm)/Znq2/Al architecture in which the emission layer was deposited in a vacuum gas phase as above. The maximal brightness value of 16 200 cd/m2 obtained by the authors is the highest value ever measured for Znq2. Lim et al. [18] modified the TPD/Znq2 structure and proposed the an ITO/TPD:PMDA-ODA PI/Znq2/Al structure where PMDA-ODA P1 was used as a matrix polymer binding the HTM. The emission layer was thermally evaporated and the maximum brightness value obtained was higher than that of the authors and amounted to 3000 cd/m². Burlov et al. [43] presented an OLED containing a Znq2 derivative with an ITO/PEDOT: PSS/mCp/zinc complex/ TPDI/LiF/Al structure which was characterised by a maximum brightness of 2103 cd/m2 and a maximum emission band in the range of 478–490 nm. Other Znq2 derivatives were presented by Moraes et al. [44] (ITO/PEDOT:PSS/ PVK/zinc complex/ TmPyPB/Ca/Al). These diodes had a maximum brightness between 536 and 668 cd/m² which is higher than the authors' reported value.
Conclusions
In this paper, Znq2:PVK thin films were prepared for their potential use in OLED applications and their optical and morphological properties were investigated. From the FTIR spectra, it was observed that the Znq2 molecule tends to form a dihydrate complex. The dissolution of this complex and its rapid recrystallization during layer formation cause changes in the coordination environment of the central atom. By annealing the films at 130 °C for 1 h, it was possi-ble to remove water and restore Znq2 to its anhydrous form
In the case of PL measurements, a significant shift of a Znq2 emission maximum from 505 nm to 550 nm was observed for the annealed sample. The changes and variations in the obtained PL spectra can be explained by: i) formation of an intrachain excimer due to the interaction between excited states of neighbouring carbazole units in PVK, ii) ILCT transition involving electron intraligand charge transfer in Znq2 under influence of the molecular structure and the surrounding matrix, iii) structural transformation of Znq2⋅2H2O into anhydrous Znq2 tetramer caused by annealing, iv) changes in PL intensity with excitation wavelength due to the overlap between excitation and absorption spectra, and v) vibrational coupling between the vibrational states of ligands and electronic transitions causing shifts of the PL peaks.
The structure of the Znq2:PVK system obtained by the DFT method indicates a strong π-π stacking between the 8‑hydroxyquinoline moiety of Znq2 and the carbazole rings in the polymer chain.
The authors have found that the ITO/PEDOT: PSS/Znq2:PVK/Al OLED structure, where the Znq2:PVK layer was not annealed, showed a maximum brightness value of about 83 cd/m2 with CE 0.12 cd/A. The presence of water may be the reason for such low OLED parameters. This thesis was confirmed for the ITO/PEDOT:PSS/Znq2: PVK/Al structure, where the Znq2:PVK layer was annealed at 130 °C. For the annealed OLED, the maximum brightness value was about 219 cd/m2 with CE 0.26 cd/A. The obtained diode has lower parameters compared to other Znq2 diodes described by other authors likely due to its structure and the method of manufacturing the active layers. Future work is planned to improve these parameters by adding additional layers supporting charge transport
Authors’ statement
Research concept and design: M.S., R.S., and B.D.-Z.; collection and/or assembly of data: M.S., I.E.B., A.K.-K., M.P.-K., E.G., P.P., R.S., and B.D.-Z.; data analysis and interpretation: M.S., I.E.B., A.K.-K., E.G., P.P., R.S., and B.D.-Z.; writing the article: M.S., A.K.-K., and I.E.B.; critical revision of the article: R.S. and B.D.-Z.; final approval of article: M.S., I.E.B., A.K.-K., E.G., P.P., R.S., and B.D.-Z.
Painuly, D., Masram, D. T., Rabanal, M. E. & Nagpure, I. M. The effect of ethanol on structural, morphological and optical properties of Li(I) 8–hydroxyquinoline phosphor. J. Lumin. 192, 1180–1190 (2017). https://doi.org/10.1016/j.jlumin.2017.08.054
Painuly, D., Singhal, R., Kandwal, P. & Nagpure, I .M. Structural, optical and decay properties of zinc(II) 8-hydroxyquinoline and its thin film. J. Electron. Mater. 49, 6096–6106 (2020). https://doi.org/10.1007/s11664-020-08255-y
Pérez-Bolivar, C. P., Takizawa, S., Nishimura, G., Montes, V. A. & Anzenbacher, P. Jr. High-efficiency tris(8-hydroxyquinoline) aluminum (Alq3) complexes for organic white-light-emitting diodes and solid-state lighting. Chem. Eur. J. 17, 9076–9082 (2011). https://doi.org/10.1002/chem.201100707
Painuly, D. et al. Phase stability and transformation of the α to ε- phase of Alq₃ phosphor after thermal treatment and their photo- physical properties. J. Phys. Chem. Solids 121, 396–408 (2018). https://doi.org/10.1016/j.jpcs.2018.05.035
Hamada, Y. at al. Organic electroluminescent devices with 8- hydroxyquinoline derivative-metal complexes as an emitter. Jpn. J.Appl. Phys. 32, 514 (1993). https://doi.org/10.1143/JJAP.32.L514
Ghedini, M., Deda, M. L., Aiello, I. & Grisolia, A. Fine-tuning the luminescent properties of metal-chelating 8-hydroxyquinolines through amido substituents in 5-position. Inorg. Chim. Acta 357, 33– 40 (2004). https://doi.org/10.1016/S0020-1693(03)00427-4
Sapochak, L. S. et al. Electroluminescent zinc(II) bis(8- hydroxyquinoline): Structural effects on electronic states and device performance. J. Am. Chem. Soc. 124, 6119–6125 (2002). https://doi.org/10.1021/ja0201909
Donze, N., Pechy, P., Gratzel, M., Schaer, M. & Zuppiroli, L. Quinolinate zinc complexes as electron transporting layers in organic light-emitting diodes. Chem. Phys. Lett. 315, 405–410 (1999). https://doi.org/10.1016/S0009-2614(99)01272-5
Du, N., Mei, Q. & Lu, M. Quinolinate aluminum and zinc complexes with multi-methyl methacrylate end groups: Synthesis, photoluminescence, and electroluminescence characterization. Synth. Metals 149, 193–197 (2005). https://doi.org/10.1016/j.synthmet.2005.01.001
Giro, G. et al. The role played by cell configuration and layer preparation in LEDs based on hydroxyquinoline metal complexes and a triphenyl-diamine derivative (TPD). Synth. Met. 102, 1018– 1019 (1999). https://doi.org/10.1016/S0379-6779(98)01268-5
Hopkins, T. A. Substituted aluminum and zinc quinolates with blue- shifted absorbance/luminescence bands: Synthesis and spectro- scopic, photoluminescence, and electroluminescence characteriza- tion. Chem. Mater. 8, 344–351 (1996). https://doi.org/10.1021/cm9503442
Sapochak, L. S. et al. Effects of systematic methyl substitution of metal (III) tris(n-Methyl-8-Quinolinolato) chelates on material properties for optimum electroluminescence device performance. J. Am. Chem. Soc. 123, 6300–6307 (2001). https://doi.org/10.1021/ja010120m
Shukla, V. K. & Kumar, S. Conversion of a green light emitting zinc-quinolate complex thin film to a stable and highly packed blue emitter film. Synth. Met. 160, 450–454 (2010). https://doi.org/10.1016/j.synthmet.2009.11.030
Painuly, D. et al. The modification in the photo–physical properties via transformation of synthetic dihydrated Znq2 to anhydrous (Znq2)4 tetramer by sublimation process. Opt. Mater. 82, 175–189 (2018). https://doi.org/10.1016/j.optmat.2018.04.044
Jafari, F., Elahi, S. M. & Jafari, M. R. A facile synthesis and opto-electronic characterization of Znq₂ and Alq₃ nano-complexes. Appl.Phys. A 124, 574 (2018). https://doi.org/10.1007/s00339-018-1978-6
Rawat, M., Prakash, S., Singh, C. & Anand, R. S. Synthesis and study of chemical and photo‐physical properties of quinolinate aluminum and zinc complexes in organic light emitting diodes (OLEDs). AIP Conf. Proc. 1391, 187–189 (2011). https://doi.org/10.1063/1.3646819
Lim, H. et al. Polymeric light-emitting diodes utilizing TPD- dispersed polyimide thin film and organometallic complex. Proc. SPIE 3281, Polymer Photonic Devices (1998). https://doi.org/10.1117/12.305439
Sano, T. et al. Design of conjugated molecular materials for optoelectronics. J. Mater. Chem. 10, 157–161 (2000). https://doi.org/10.1039/A903239H
Sypniewska, M. et al. Tris(8-hydroxyquinoline)aluminium in a polymer matrix as an active layer for green OLED applications. Opto-Electron. Rev. 31, e146105 (2023). https://doi.org/10.24425/opelre.2023.146105
Frisch, M. J. et al. Gaussian 16, Rev. C.01. (Gaussian, Inc., Wallingford CT, 2016).
Chai, J.-D. & Head-Gordon, M. Long-range corrected hybrid density functionals with damped atom–atom dispersion corrections. Phys. Chem. Chem. Phys. 10, 6615–6620 (2008). https://doi.org/10.1039/B810189B
Weigend, F. & Ahlrichs, R. Balanced basis sets of split valence, triple zeta valence and quadruple zeta valence quality for H to Rn: Design and assessment of accuracy. Phys. Chem. Chem. Phys. 7, 3297–3305 (2005). https://doi.org/10.1039/B508541A
Bannewart, C., Ehlert, C. & Grimme, S. GFN2-xTB – An acurate and broadly parametrized self-consistent tight-binding quantum chemical method with multipole electrostatics and density- dependent dispersion contributions. J. Chem. Theory Comput. 15, 1652–1671 (2019). https://doi.org/10.1021/acs.jctc.8b01176
Le Bahers, T., Adamo, C. & Ciofini, I. A qualitative index of spatial extent in charge-transfer excitations. J. Chem. Theory Comput. 7, 2498–2506 (2011). https://doi.org/10.1021/ct200308m
Johnson, E. R. et al. Revealing noncovalent interactions. J. Am. Chem. Soc. 132, 6498–6506 (2010). https://doi.org/10.1021/ja100936w
Contreras-Garcia, J. et al. NCIPLOT: A Program for Plotting Noncovalent Interaction Regions. J. Chem. Theory Comput. 7, 625– 632 (2011). https://doi.org/10.1021/ct100641a
Barbosa de Brito, E. B., de Morais, A., Nei de Freitas, J., Valaski, R. & de Fátima Vieira Marques, M. Improved properties of high molar mass poly(9-vinylcarbazole) and performance as a light emitter compared with the commercial PVK. Mater. Sci. Eng. B 286, 116020 (2022). https://doi.org/10.1016/j.mseb.2022.116020
Shahedi, Z., Jafari, M. R. & Zolanvari, A. A., Synthesis of ZnQ2, CaQ2, and CdQ2 for application in OLED: Optical, thermal, and electrical characterizations. J. Mater. Sci. Mater. Electron. 28, 7313–7319 (2017). https://doi.org/10.1007/s10854-017-6417-5
Hien, N. at al. Synthesis, structure, photophysical properties and DFT investigation of novel Zn (II) complexes bearing π-extended 8- hydroxyquinoline-derived ligands. J. Mol. Struct. 1311, 138464 (2024). https://doi.org/10.1016/j.molstruc.2024.138464
Knysh, I. at al. Reference CC3 excitation energies for organic chromophores: benchmarking TD-DFT, BSE/GW and wave function methods. J. Chem. Theory Comput. 20, 8152–8174 (2024). https://doi.org/10.1021/acs.jctc.4c00906
Jafari, F., Elahi, S. M. & Jafari, M. R. A facile synthesis and optoelectronic characterization of Znq2 and Alq3 nano-complexes. Appl. Phys. A 124, 574 (2018). https://doi.org/10.1007/s00339-018-1978-6
Thinh, P. X., Basavaraja, C., Kim, D. G. & Huh, D. S. Characterization and electrochemical behaviors of honeycomb- patterned poly(N-vinylcarbazole)/polystyrene composite films. Polym. Bull. 69, 81–94 (2012). https://doi.org/10.1007/s00289-012-0727-9
Hosseini, S. M., Jashni, E., Jafari, M. R., Van der Bruggen, B. & Shahedi, Z. Nanocomposite polyvinyl chloride-based heterogeneous cation exchange membrane prepared by synthesized ZnQ2 nanoparticles: Ionic behavior and morphological characterization. J. Membr. Sci. 560, 1–10 (2018). https://doi.org/10.1016/j.memsci.2018.05.007
Bakhshipour, S., Shahedi, Z., Mirahmadi, F., Fereidonnejad, R. & Hesani, M. Effect of different in situ temperatures on the crystallinity and optical properties of green synthesized 8- hydroxyquinoline zinc by saffron extract, Opt. Contin. 1, 1401–1412 (2022). https://doi.org/10.1364/OPTCON.459222
Hu, B.-s., X. et al. The effects of crystal structure on optical absorption/photoluminescence of bis (8-hydroxyquinoline) zinc. Solid State Commun. 136, 318–322 (2005). https://doi.org/10.1016/j.ssc.2005.08.021
Kong, F., Liu, J., Li, X. F., An, Y. & Qiu, T. Enhanced emission from Alq3 in PVK/Alq3 blend films based on resonance energy transfer. J. Polym. Sci. B: Polym. Phys. 47, 1772–1777 (2009). https://doi.org/10.1002/polb.21779
Fan, Y. et al. Hydrothermal in-situ growth of tris(8-hydroxy- quinolate) aluminum nanorods thin films. Thin Solid Films 519, 7659–7663 (2011). https://doi.org/10.1016/j.tsf.2011.05.015
Popielarski, P., Mosinska, L., Zorenko, T. & Zorenko, Y. Luminescence of tris(8-hydroxyquinoline) aluminium thin films under synchrotron radiation excitation. J. Lumin. 261, 119930 (2023). https://doi.org/10.1016/j.jlumin.2023.119930
Zhao, Y. S. et al. Photoluminescence and electroluminescence from tris(8‐hydroxyquinoline) aluminum nanowires prepared by adsorbent‐assisted physical vapor deposition. Adv. Funct. Mater. 16, 1985–1991 (2006). https://doi.org/10.1002/adfm.200600070
Sypniewska, M. et al. Organic LEDs based on bis(8- hydroxyquinoline)zinc derivatives with a styryl group. Molecules 28, 7435 (2023). https://doi.org/10.3390/molecules28217435
Burlov, A. S. et al. Synthesis, structure, photo-and electro- luminescent properties of methyl-and alkoxy-substituted 4-methyl- N-[2-(phenyliminomethyl) phenyl] benzenesulfamides and their zinc (II) complexes. Opt. Mater. 157, 116412 (2024). https://doi.org/10.1016/j.optmat.2024.116412
Moraes, E. S. et al. Zinc (ii)-heteroligand compounds for wet processing OLEDs: a study on balancing charge carrier transport and energy transfer. Mater. Adv. 5, 7778–7788 (2024). https://doi.org/10.1039/d4ma00581c
Supporting Information
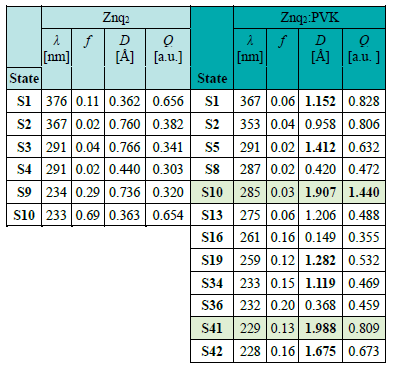
The symmetry of the system leads to the presence of nearly degenerate states. The shorter wavelength part of the absorption spectrum, which is clear for the isolated Znq2 molecule, with a degenerate signal of relatively weak intensity at 291 nm and two additional almost degenerate strong transitions at 234 and 233 nm, becomes much more complicated when Znq2 interacts with the PVK polymer chain. The presence of the polymer chain introduces a signal at approximately 259 nm, corresponding to the absorption of the carbazole moiety. Similarly, as in the case of Alq3:PVK [20], the natural transition orbitals for these signals indicate the charge transfer upon excitation, occurring between the Znq2 and PVK. Le Bahers indexes for the quantification of the charge transfer characters of the transitions, presented in Table S1, together with the centroids of the charge depletion and charge enhancement upon excitation (Fig. S1), confirm that different parts of the Znq2:PVK are responsible for the transitions below 300 nm.
Fig. S1. Charge depletion (blue ball) and charge enhancement
(red ball) centroids calculated according to Le Bahers
CT indexes for Znq2 (upper panel) and Znq2:PVK
complex for selected transitions.
Fig. S3. (a) Natural transition orbitals (NTOs) for the
representative most intensive transitions of Znq2,
(b) natural transition orbitals for the representative
most intensive transitions of Znq2:PVK.
Table S1. Le Bahers charge transfer parameters, transfer distance D, and charge transferred Q for the selected most intensive transitions for isolated Znq2 and Znq2:PVK, calculated within the TD-ωB97X-D/def2-SVP approach.