Nanocomposites based on copper and zinc oxides with various crystalline structures – synthesis, characterisation, and application
Joanna Rymarczyk1*
Izabela Stępińska1
Mirosław Kozłowski1
Ryszard Diduszko2
- Łukasiewicz Research Network – Tele and Radio Research Institute, ul. Ratuszowa 11, 03-450 Warsaw, Poland
- Institute of Physics, Polish Academy of Sciences, Al. Lotników 32/46, 02-668 Warsaw, Poland
Article Info
Received 27 Nov. 2025
Received in revised form 30 Dec. 2025
Accepted 06 Jan. 2026
Available on-line 25 Feb. 2026
Keywords: CuO; ZnO; physical vapour deposition; thermal oxidation; nanocomposite.
Abstract
The article presents methods for synthesising nanocomposites of Cu and Zn with various crystalline structures, ranging from metallic oxides to solid solutions. Using physical vapour deposition and thermal oxidation, two types of nanocomposites were obtained: (I) Cu0.76Zn0.24 nanobrass covered with a porous ZnO nanofoam, and (II) CuO nanowires with a ZnO forming a core–shell nanostructure. The morphological and structural properties of the nanocomposites were analysed using scanning electron microscopy (SEM), transmission electron microscopy (TEM, HRTEM), and X-ray diffraction (XRD). The nanobrass with ZnO nanofoam composite exhibited strong gas-sensing activity. Its electrical resistance increased significantly when exposed to gases, showing responses of 158% for methane, 131% for hydrogen, and 91% for ammonia at 200 °C, with full reversibility upon air flushing. The CuO-ZnO nanowire composite demonstrated high photocatalytic efficiency. These findings highlight the potential of the developed nanocomposites for applications in gas sensing and photocatalytic environmental treatment.
1. Introduction
With the rapid development of industrialisation, a large number of gases such as nitrogen oxides (NOx), carbon monoxide (CO), sulphur dioxide (SO2), and various volatile organic compounds are released into the atmosphere. These pollutants seriously affect human life and the natural environment; therefore, it is important to develop highly sensitive methods for their detection. Gas sensors, based on nanomaterials composed of copper oxide (CuO) and zinc oxide (ZnO) offer synergistic properties that can significantly improve the efficiency of gas sensors. ZnO, as an n- type semiconductor with a wide band gap (Eg = 3.4 eV [1]), has sensing properties for various gases (CO [2], NO2 [3], NH3 [4], H2 [5]). On the other hand, CuO, being a p-type semiconductor with a narrow band gap (around Eg = 1.9 eV [6]), is characterised by its exceptional electrical and thermal conductivity and a high degree of stability. Thanks to these properties, CuO is used in gas sensors based on electrical transduction.
The gas-sensing mechanism of CuO-ZnO nanocomposites is complex and influenced by the intrinsic properties of both oxides and the nature of the target gas [7]. Adsorption of gases on the nanocomposite surface occurs when a gas molecule comes into contact with its surface. This is a type of weak absorption, based on van der Waals forces, but it can pre-concentrate gas near active surface sites, leading to chemical reactions that change the concentration of charge carriers and the electrical conductivity of the material. Additionally, the combination of CuO and ZnO in a single composite creates a p-n heterojunction, which also affects the material response to gas presence [8]. The heterojunction creates a potential barrier at the CuO-ZnO interface. Reactions of gases with the material can affect the height of this barrier, which introduces an additional mechanism for regulating conductivity. On the other hand, this type of heterojunction can help separate charge carriers, reducing electron-hole recombination and increasing the material sensitivity. The sorption properties of CuO-ZnO nanocomposites also strongly depend on their surface development, as well as parameters such as specific surface area, pore volume, and pore size distribution.
CuO-ZnO nanocomposites, combining n-type and p‑type wide band gap semiconductors [9, 10], demonstrate both structural stability and sensing performance under varying thermal and environmental conditions. These qualities make them well-suited for extreme-temperature electronics, integrated optoelectronic microsystems, and renewable energy-harvesting platforms. Their tunable properties and straightforward synthesis also open pathways for applications in emerging thin-film sensors and biomedical diagnostics, enabling the development of compact, functional sensing components for nextgeneration electronics.
Contemporary studies report that nanostructuring – particularly through the formation of core-shell architectures, nanofoams, nanosheets, and decorated nanowires – substantially improves sensing performance by increasing the active surface area and optimising p-n junction behaviour. For example, CuO-ZnO nanowires grown by the wet-chemical method have demonstrated hydrogen response values exceeding 320% at 100 ppm H2 at 175 °C, with response times below 20 s [11]. Similarly, ammonia sensors based on Al-ZnO/CuO nanoparticles have shown sensitivities of 50–500 ppm at room temperature, with a response time of 14 s [12]. These enhancements arise from modulation of the depletion layer at the CuO-ZnO interface, leading to strong variations in resistance upon exposure to reducing gases. Furthermore, recent research indicates that ZnO porous materials, especially in 3D structures, can increase gas adsorption rates, significantly enhancing sensor response and stability during long-term operation [13, 14].
Parallel progress has been made in the application of CuO-ZnO materials for the photocatalytic degradation of pollutants in water systems. The structure of the CuO-ZnO heterojunction facilitates efficient charge separation, suppresses electron-hole recombination, and promotes the formation of highly reactive oxygen species such as hydroxyl radicals (•OH) and superoxide radicals (•O2⁻) [15]. This mechanism effectively accelerates the decomposition of organic contaminants. Recent reports indicate that CuO-ZnO photocatalysts can achieve more than 90% degradation of methylene blue (MB) [16] or rhodamine B [17] within 60–240 min of solar illumination. In addition, advanced composites based on CuO-ZnO coupled with graphene oxide [18, 19], graphitic carbon nitride [20], or noble metal nanoparticles [21–23] have extended photocatalytic activity into the visible region, increasing overall efficiency under natural sunlight by up to 40–60%. Beyond dye degradation, promising results have also been obtained in the reduction of Cr(VI) [18, 24 and in the decomposition of pharmaceutical residues [25 indicating the broad applicability of CuO-ZnO materials for water purification technologies.
These recent achievements demonstrate that fine control over morphology, porosity, and oxide interface structure is critical for optimising the functional performance of CuO-ZnO nanocomposites. Consequently, the development of nanostructures fabrication methods, such as the porous ZnO nanofoam on Cu0.76Zn0.24 nanobrass, and the CuO nanowires coated with ZnO presented in this work, directly addresses the need for materials that combine high surface reactivity with efficient charge transport.
2. Materials and methods
2.1. Preparation of nanocomposites
The nanocomposites, based on Cu and Zn, were synthesised using classical methods, including physical vapour deposition and thermal oxidation.
The first type of nanocomposite, nanobrass with a ZnO nanofoam, was prepared by depositing a 1 μm-thick copper layer on Al2O3 substrates and then applying a Zn layer. The thickness of Zn layers was 300 nm. Both layers were thermally evaporated from high-purity Cu and Zn rods, under a dynamic vacuum of 10-3 Pa. Afterwards, the samples were subjected to thermal oxidation at 500 °C for 60 min.
The second type of the nanocomposite consists of CuO nanowires with a ZnO nanostructure. It was obtained by depositing a 1 µm Cu layer on a substrate and then oxidising it at 400 °C for 60 min. A 50 nm Zn layer was deposited on the resulting CuO nanowires, which enveloped the entire wires. The resulting samples were then annealed at 400 °C for 60 min.
2.2. Characterisation methods
The topography and morphology of the nanocomposites were tested by a JEOL JSM-7600F scanning electron microscope (SEM).
X-ray diffraction (XRD) was used to characterise the crystal structure of the nanocomposites. XRD data were obtained with a Rigaku SmartLab 3kW diffractometer. Diffraction measurements were performed in a grazingincidence primary-beam geometry (GIXD).
Electron microscopic studies were conducted using a Talos F200X transmission microscope equipped with an energy dispersive X-ray spectroscope – a Super EDS by Bruker and a high-angle annular dark field (HAADF) detector. The research was carried out in classical transmission electron microscopy (TEM) and highresolution transmission electron microscopy (HRTEM) modes, with crystal structure analysis performed.
The performance of a nanocomposite sensor was measured using a specially designed gas chamber system. A schematic diagram of the gas-sensor measurement system is shown in Fig. 1. To measure the change in the nanocomposite resistance under the influence of gas, silver electrodes were placed on the sample surface at a distance of 13.5 mm. The sample was mounted in a sealed measurement chamber connected to a controlled gas-delivery station. Test gases (CH4, H2, and NH3 diluted in N2) and synthetic air were supplied via calibrated mass-flow controllers, enabling precise control of gas composition and flow conditions.
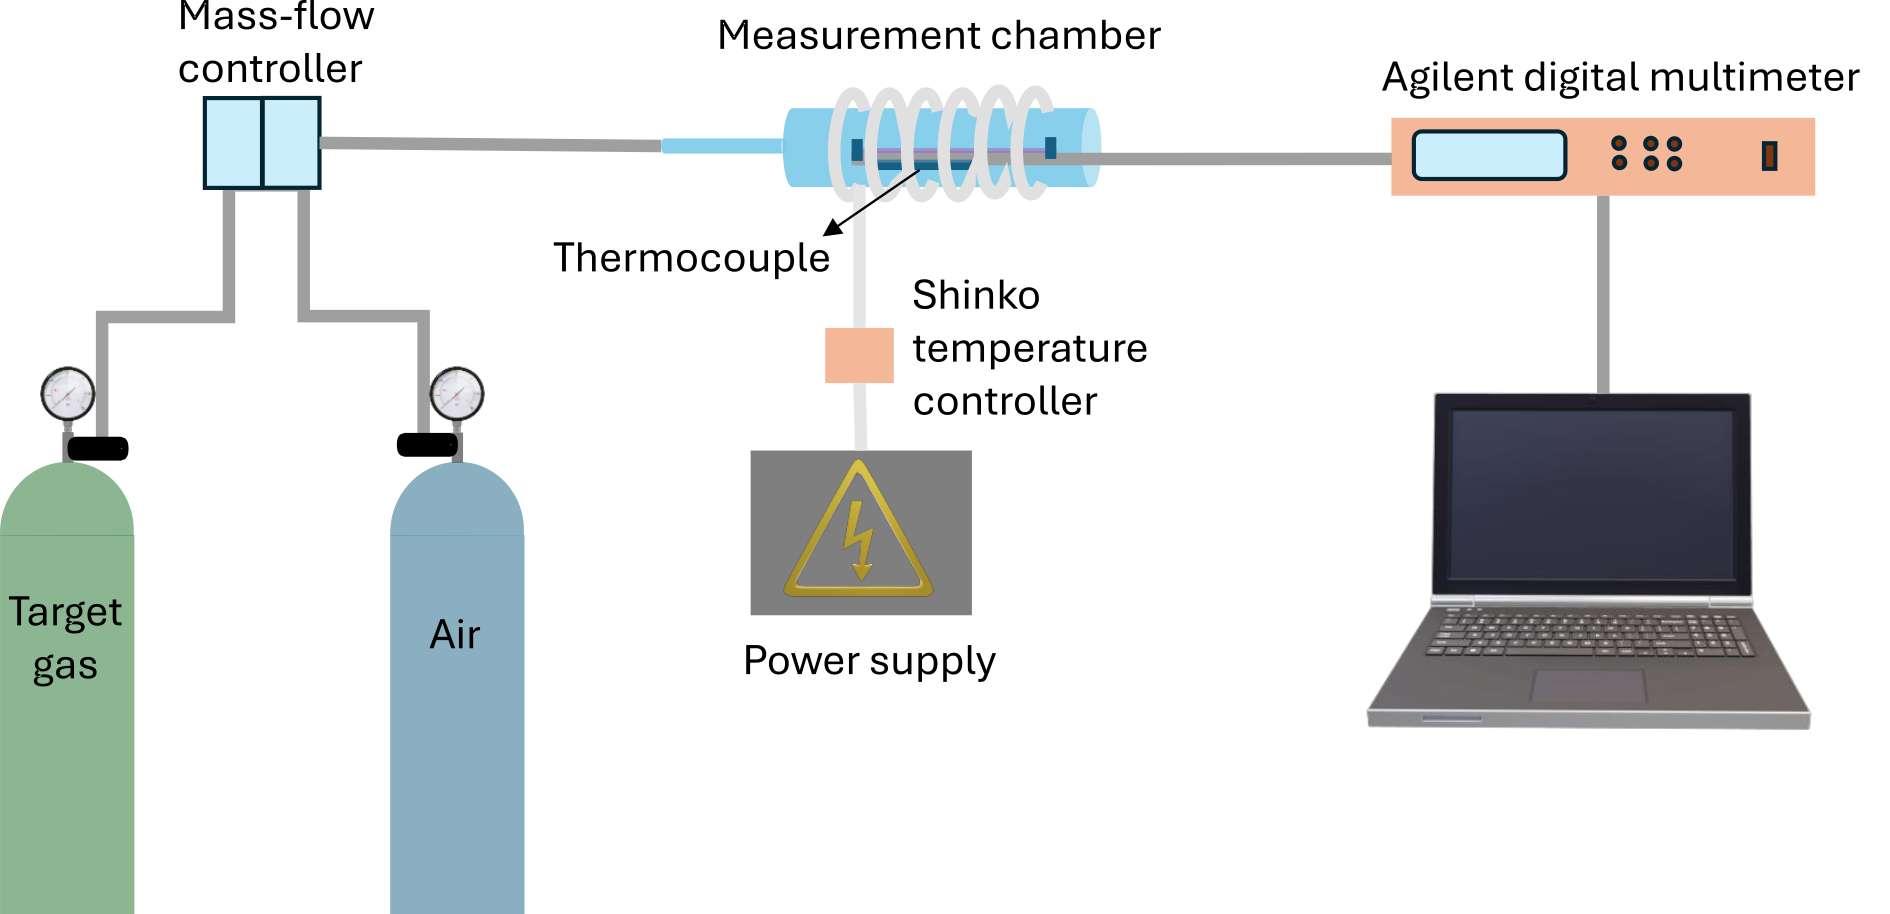
Fig. 1. Schematic diagram of the gas-sensor measurement system.
During all sensing experiments, the sensor temperature was maintained at 200 °C using a Shinko temperature controller. The temperature was maintained at a constant level throughout the entire measurement cycle, including baseline stabilisation, gas exposure, and air-flushing stages. Before gas introduction, the sensor was thermally stabilised in air until a constant baseline resistance was achieved. The total gas flow rate during all measurements was kept constant at 50 mL/min for both target gases and synthetic air. The sensor resistance was continuously monitored with an Agilent digital multimeter and recorded over time. Gas exposure experiments were conducted in repeated cycles of alternating target gas and air flows, enabling evaluation of sensor response, recovery, and repeatability.
The photocatalytic properties of the nanocomposite were examined by monitoring UV-Vis absorbance in a MB solution using a Thermo Scientific UV-Vis Evolution 300 spectrometer.
3. Results and discussion
3.1. I type of nanocomposite: the nanobrass with ZnO nanofoam
In Fig. 2, the SEM images show a sequential transformation from the individual base Cu and Zn layers to the final composite morphology. The initial Cu layer exhibited dense and uniform surface coverage [Fig. 2(a)]. The use of the thermal vapour deposition method for Cu resulted in a layer of grains with diameters of several nanometres, evenly covering the entire sample surface. Figure 2(b) shows a Zn layer deposited on a Cu layer. During thermal deposition, the Zn formed a layer consisting of regularly shaped platelets. As a result of annealing in air, a composite with a porous, three-dimensional nanofoam structure was formed.
The topography of the obtained nanomaterial in different magnifications is presented in Figs. 2(c) and (d). The crystalline structure of the nanocomposite was examined using XRD. In the X-ray diffraction spectrum shown in Fig. 3, the main characteristic peaks located at 2θ angles of 42.757°, 49.785°, and 73.063° correspond to the (111), (200), and (320) planes of Cu0.76Zn0.24 nanobrass, respectively (JCPDS card number 04-004-8062). In addition to the distinct peaks originating from the Cu-Zn alloy, ZnO peaks at the following 2θ angles are also clearly visible: 31.77° (100), 34.42° (002), 36.25° (101), 47.54° (102), 56.60° (110), and 62.86° (103) (JCPDS card number 1314-13-2). Additionally, Cu peaks and very weak CuO peaks are apparent in the spectrum.
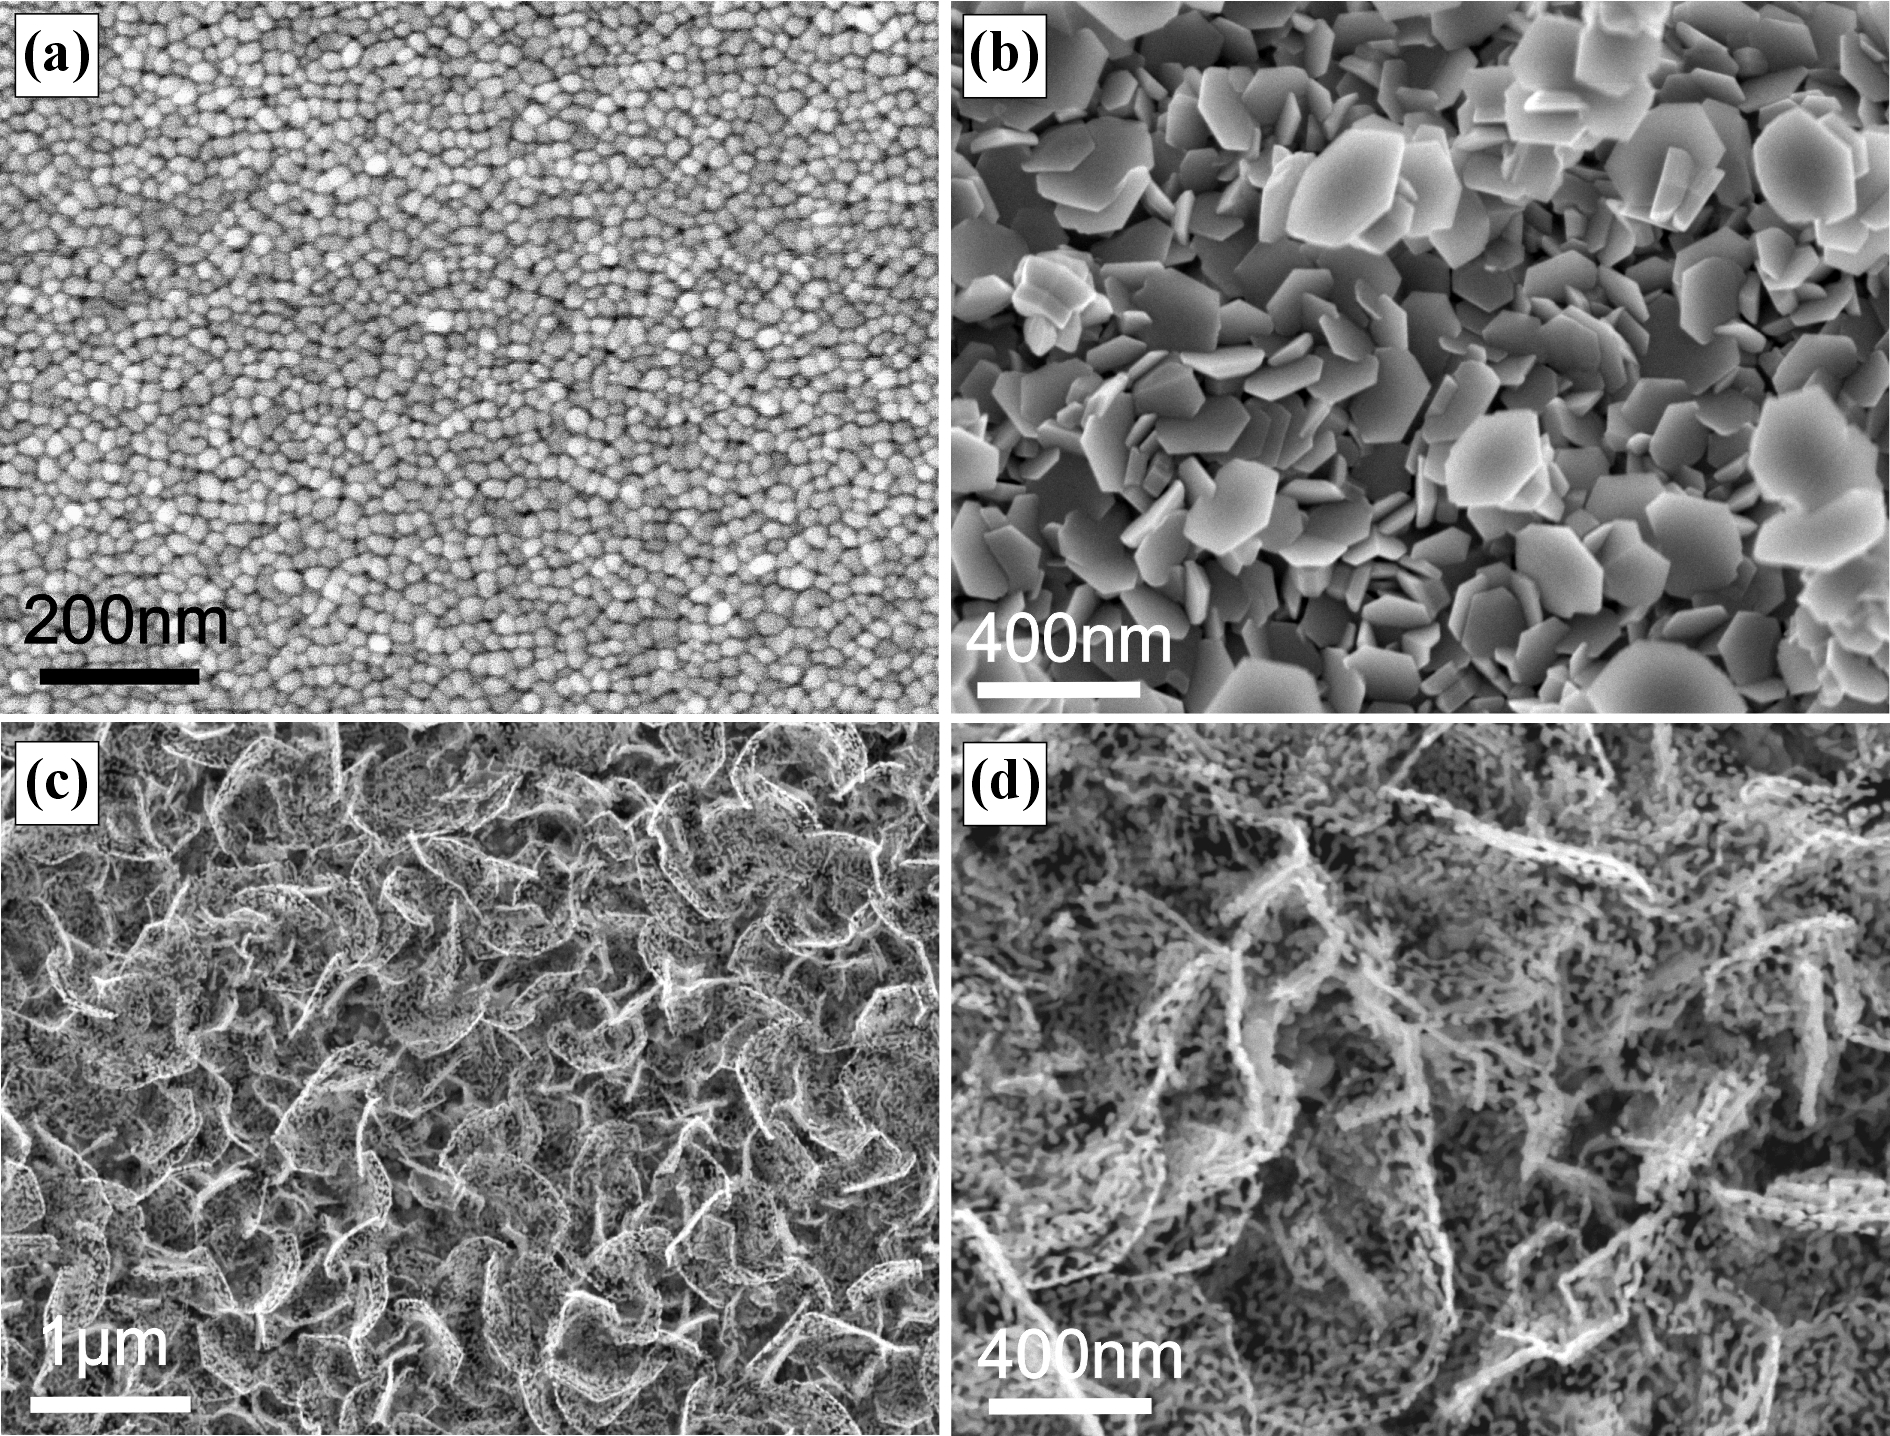
Fig. 2. SEM images of (a) Cu layer, (b) Zn layer, (c) and (d) the nanobrass with the ZnO nanofoam.
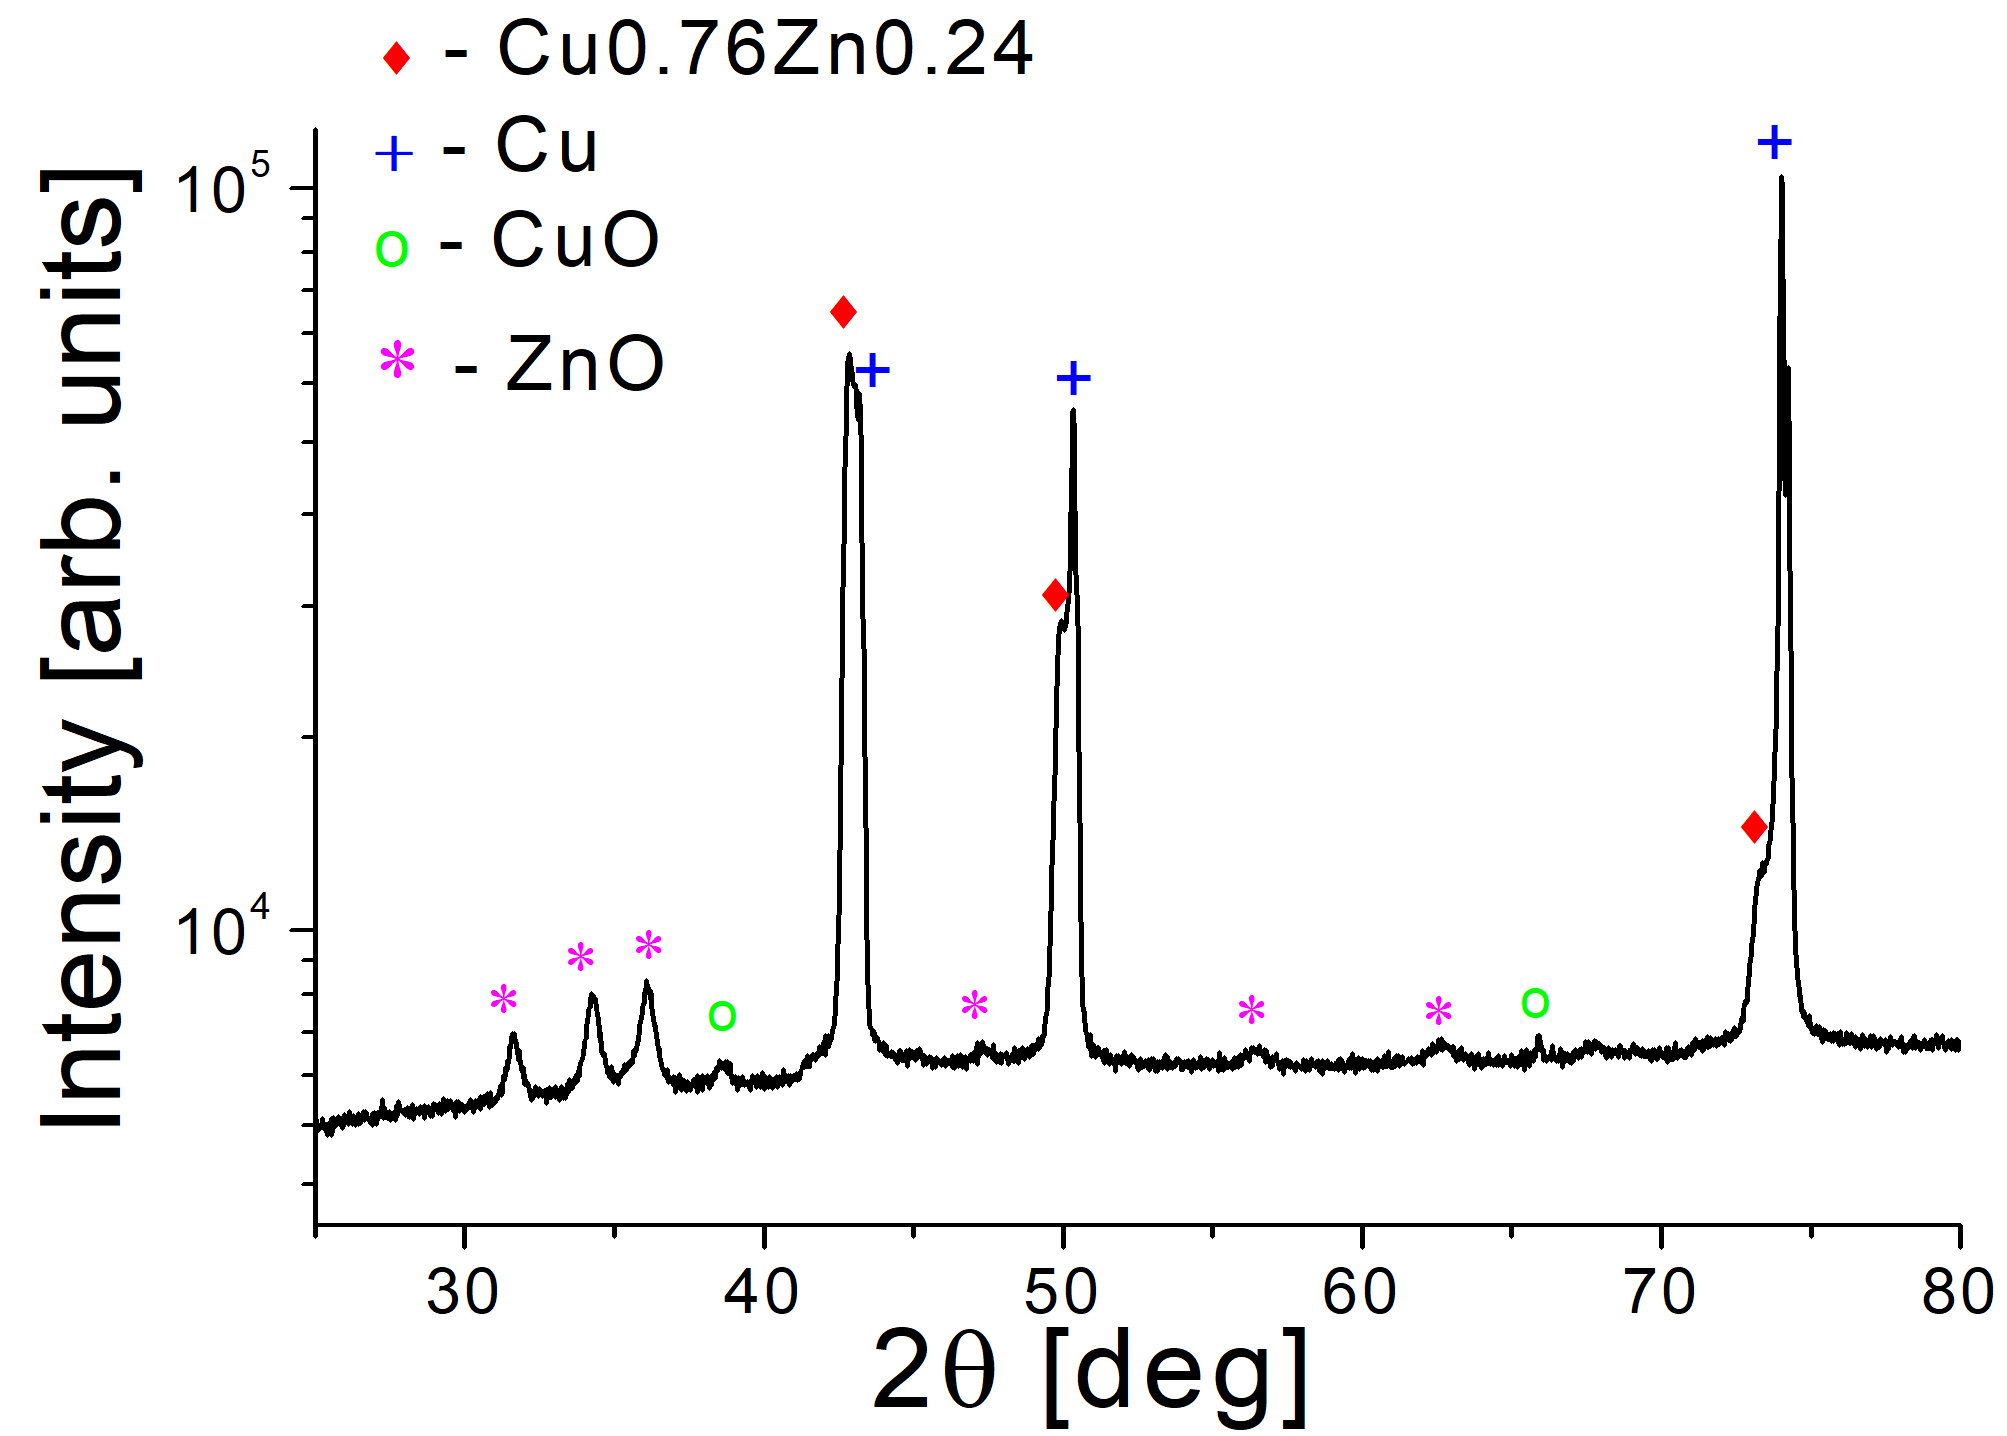
Fig. 3. X-ray diffraction spectrum of the I type of nanocomposite – the nanobrass with the ZnO nanofoam.
These results confirmed the formation of a multiphase system comprising Cu, ZnO, and intermediate brass phases, demonstrating that thermal oxidation facilitated interdiffusion and alloying between the Cu and Zn components. During the process, the Zn layer was fully oxidised, forming a porous, hexagonal wurtzite ZnO layer on the nanocomposite surface.
Figure 4(a) presents the TEM results of the I type of the nanocomposite and Figure 4(b) shows the enlargement of a fragment of the nanostructure with the area of analysis performed using the high-resolution method marked [Fig. 4(c)]. The distance between the crystallographic planes of the structure taken from the top layer of the nanocomposite was measured to be 0.24 nm, which is consistent with the distance between the (101) planes of ZnO. It can be concluded that the porous foam visible on the surface is crystalline ZnO.
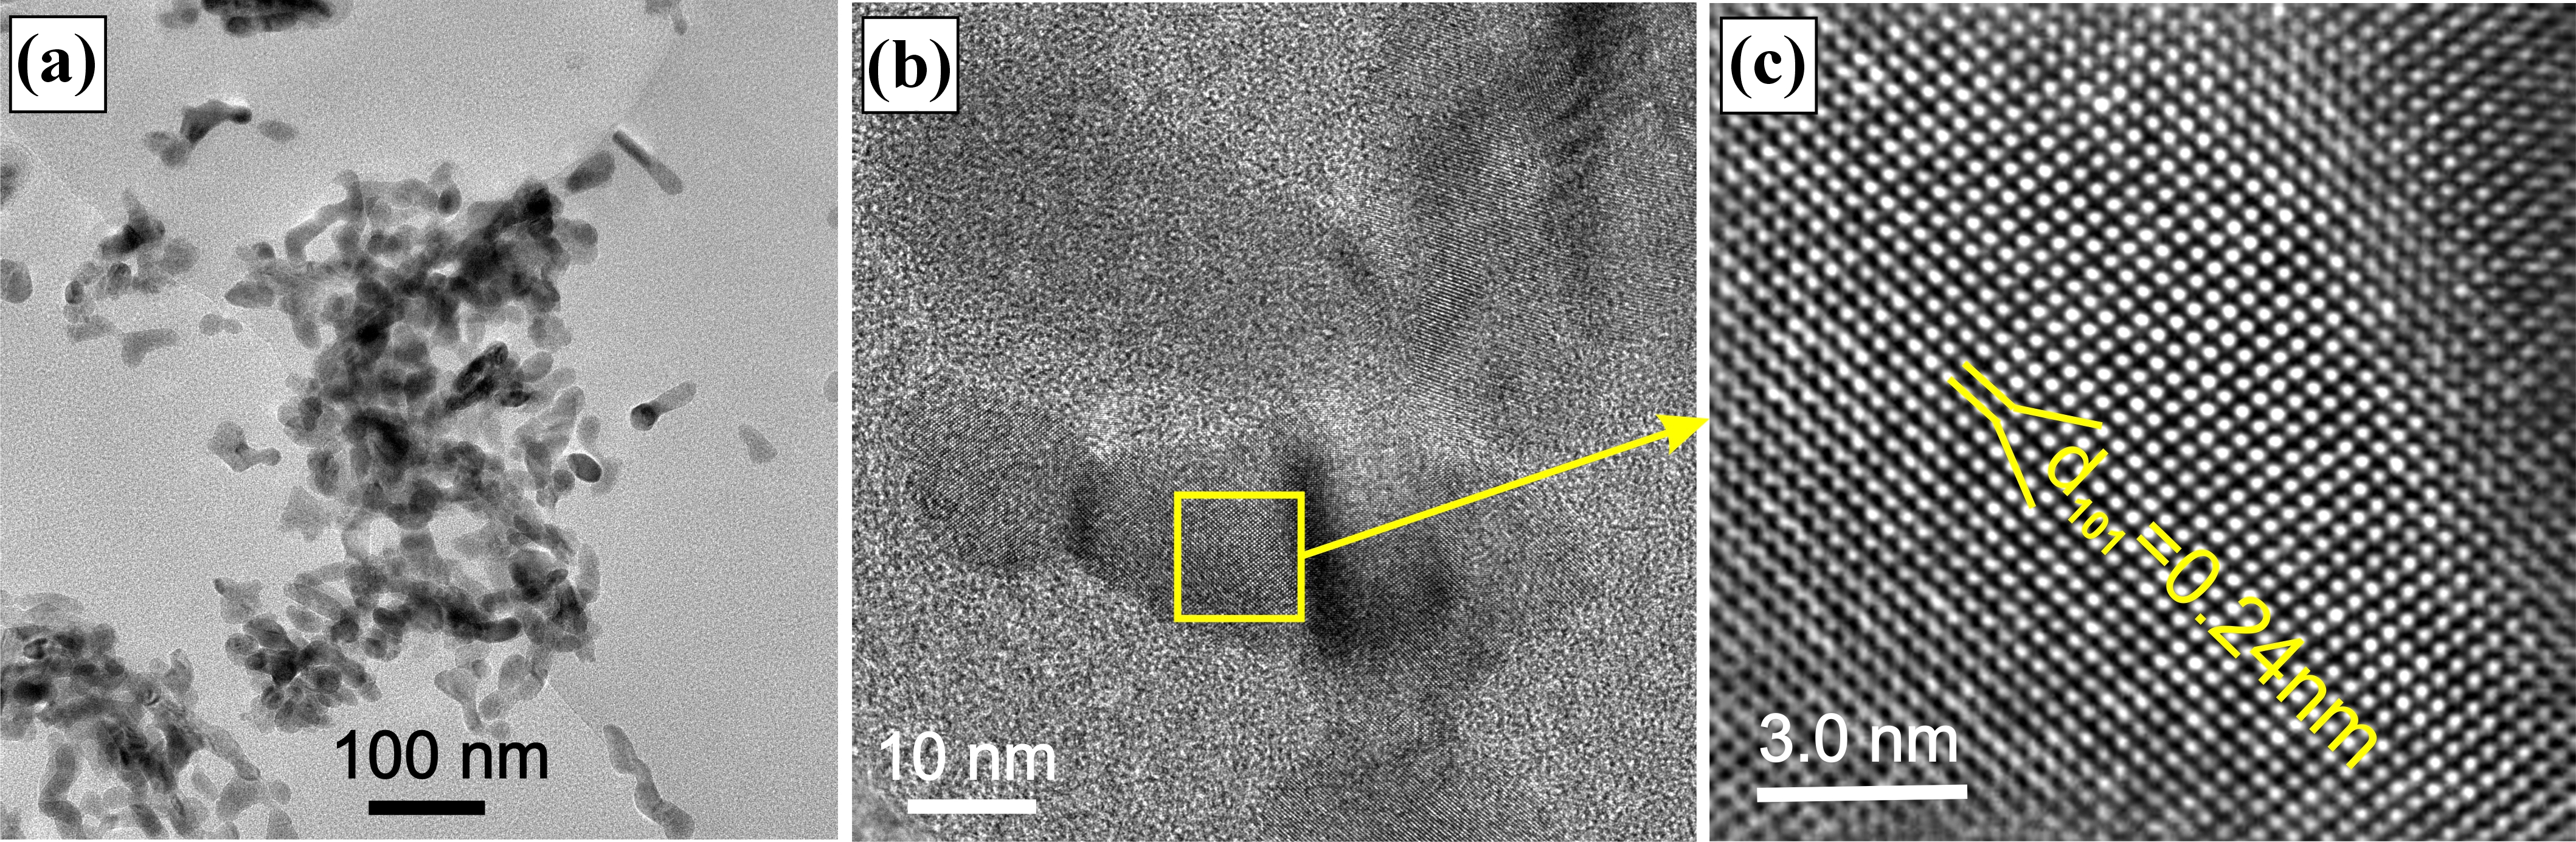
Fig. 4. TEM images of (a) the nanobrass with the ZnO nanofoam, (b) nanostructure with the marked area of analysis, (c) HRTEM with the measurement of the interplanar distance of the ZnO nanostructure.
TEM imaging provided further evidence of the nanocomposite hierarchical structure. Electron diffraction patterns [Fig. 5(a)] confirmed crystalline ZnO formation and HAADF imaging [Fig. 5(b)] showed compositional contrast consistent with Cu–Zn–O domains. EDS elemental mapping [Fig. 5(c)] demonstrated a uniform distribution of Cu, Zn, and O throughout the material, supporting the formation of composite rather than isolated phase regions.
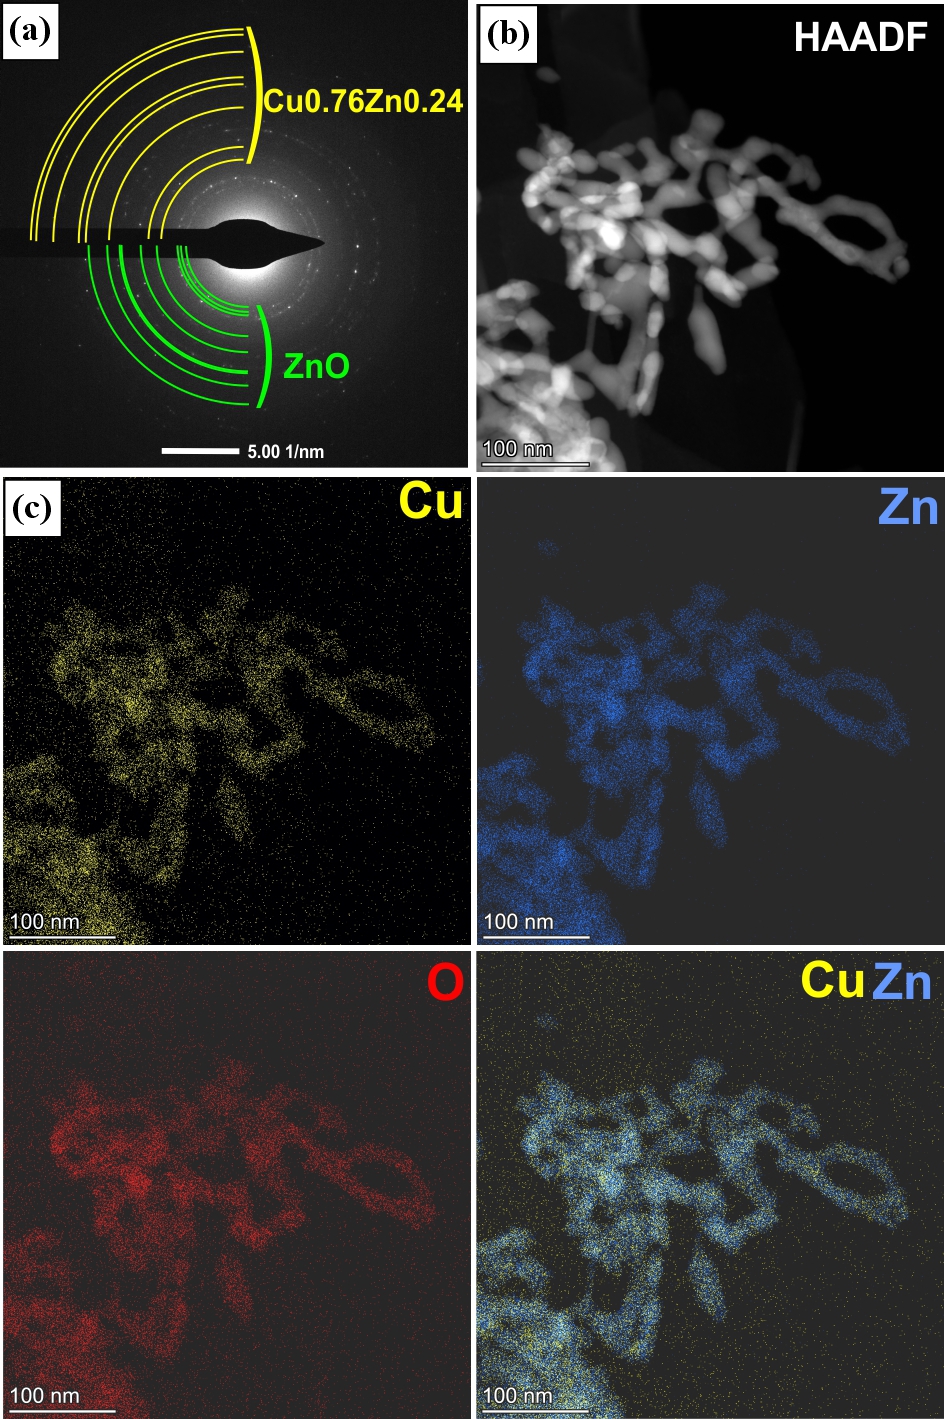
Fig. 5. (a) Electron diffraction pattern of the I type of nanocomposite, (b) TEM images of the nanobrass with the ZnO nanofoam with material Z contrast in the HAADF mode, (c) EDS maps showing the distribution of Cu, Zn, and O.
3.2. II type of nanocomposite: CuO nanowires with a ZnO nanostructure
Topographic analysis of the second type of nanocomposite was performed after each synthesis step and is presented in Fig. 6. SEM imaging showed that thermal oxidation of the Cu layer deposited on the Al2O3 substrate resulted in the growth of CuO nanowires that covered the entire sample surface [Fig. 6(a)]. The nanowires ranged in length from a few nanometres to 3 μm and in a diameter from 20 to 100 nm. The topography of CuO with a Zn layer is shown in Fig. 6(b). The deposition of a Zn layer and reannealing in oxygen resulted in a noticeable surface modification. The final result [Figs. 6(c) and (d)] was a stable structure consisting of nanowires uniformly decorated with a ZnO nanostructure, forming a large-area core-shell morphology. The XRD analysis revealed that thermal oxidation of the sample resulted in the formation of a crystalline phase of
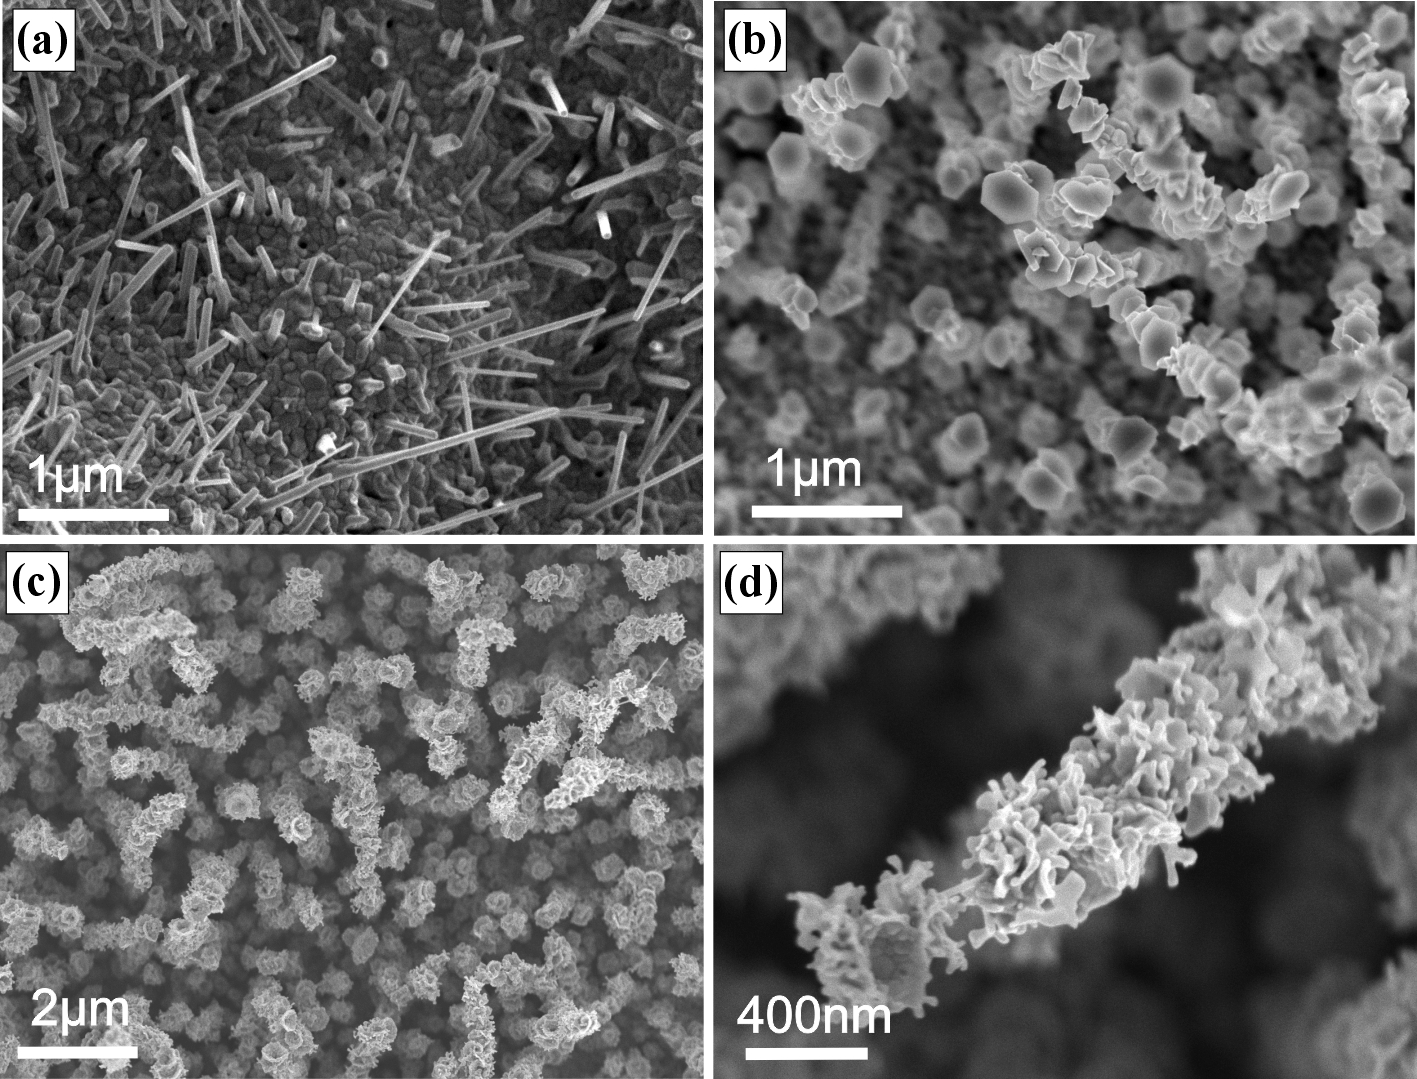
Fig. 6. SEM images of (a) CuO nanowires, (b) Zn on CuO nanowires, (c), (d) CuO-ZnO nanowires.
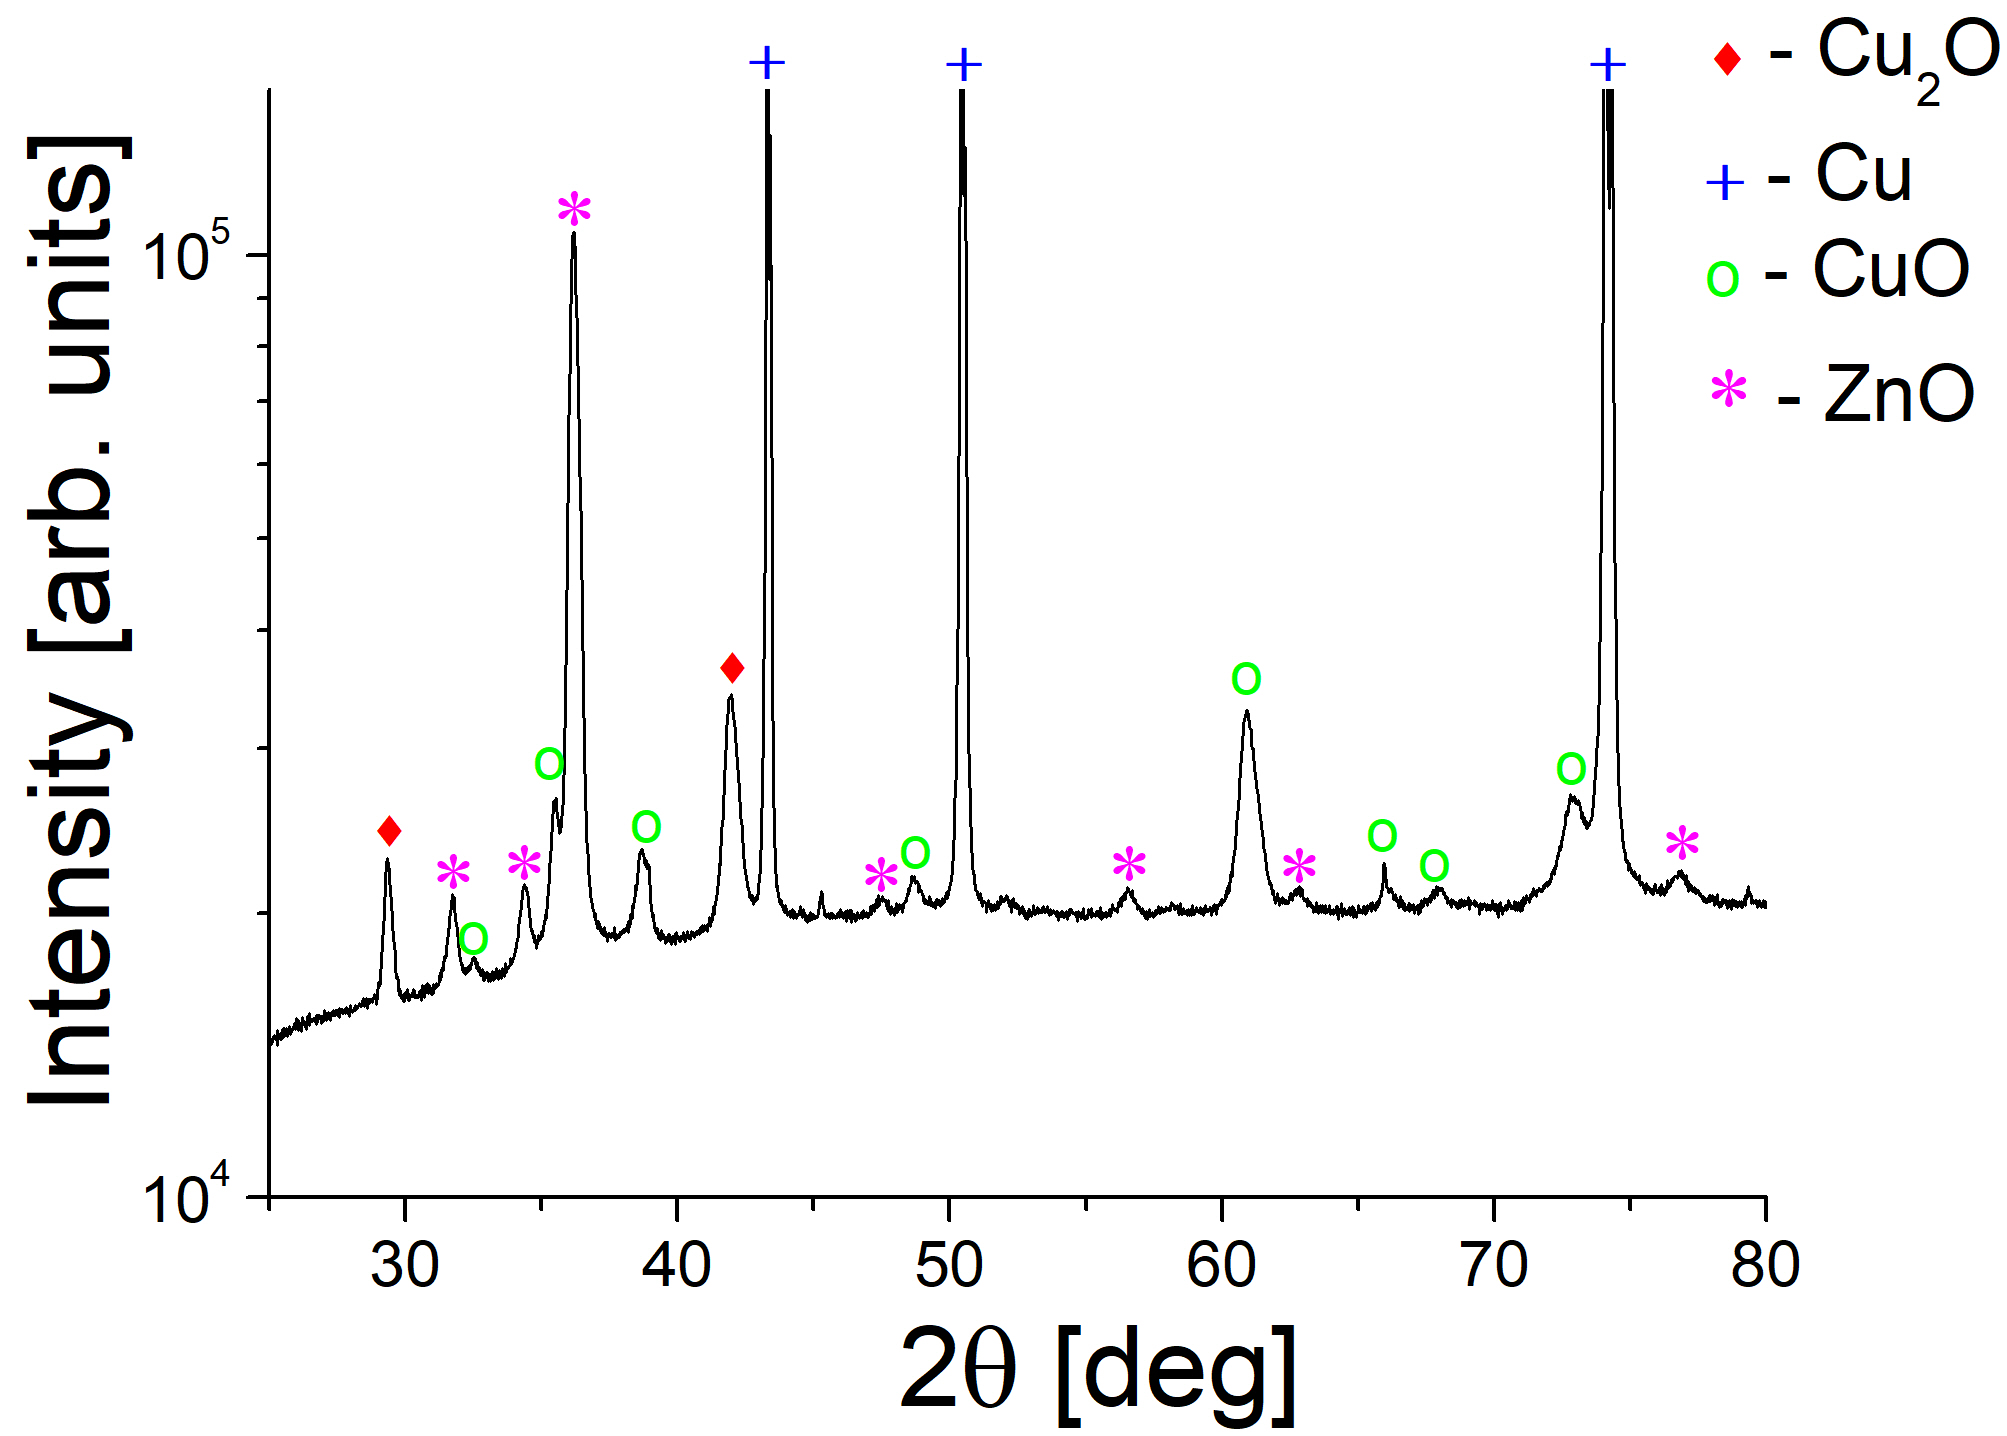
Fig. 7. X-ray diffraction spectrum of the II type of nanocomposite: CuO nanowires with ZnO nanostructure.
copper(I) oxide and a wurtzite ZnO structure. In the XRD spectrum, presented in Fig. 7, the major characteristic peaks situated at 2θ angles of 32.54°, 35.53°, 38.73°, 38.92°, 48.70°, 58.55°, 60.96°, 65.99°, 67.96°, and 72.82° − corresponded to the (110), (002), (111), (200), (202), − (202), (113), (022), (113), and (311) planes, respectively, indicating the formation of CuO (JCPDS card number 03065-2309). The diffraction peaks visible at 31.77°, 34.39°, 36.17°, 47.55°, 56.61°, 62.80°, 76.85° correspond to the (100), (002), (101), (102), (110), (103), and (202) planes of the hexagonal wurtzite ZnO structure, respectively (JCPDS card number 1314-13-2). The spectrum also shows peaks from Cu and Cu2O. This indicates that oxidation did not occur throughout the entire volume.
TEM analysis provided a nanoscale insight into the composite structure. The ZnO nanostructures were clearly observed on the CuO nanowires, and HRTEM images enabled measurement of the interplanar spacings of both ZnO and CuO, confirming their crystallinity and phase identity. Figure 8(a) presents TEM images of a CuO nanowire with a ZnO nanostructure, with the marked area of the analysis. The spacing measured in Fig. 8(b) is 0.25 nm, consistent with the (101) planes of ZnO, while the values of 0.27 nm and 0.25 nm in Fig. 8(c) correspond to the (110) and (111) planes of CuO, respectively.
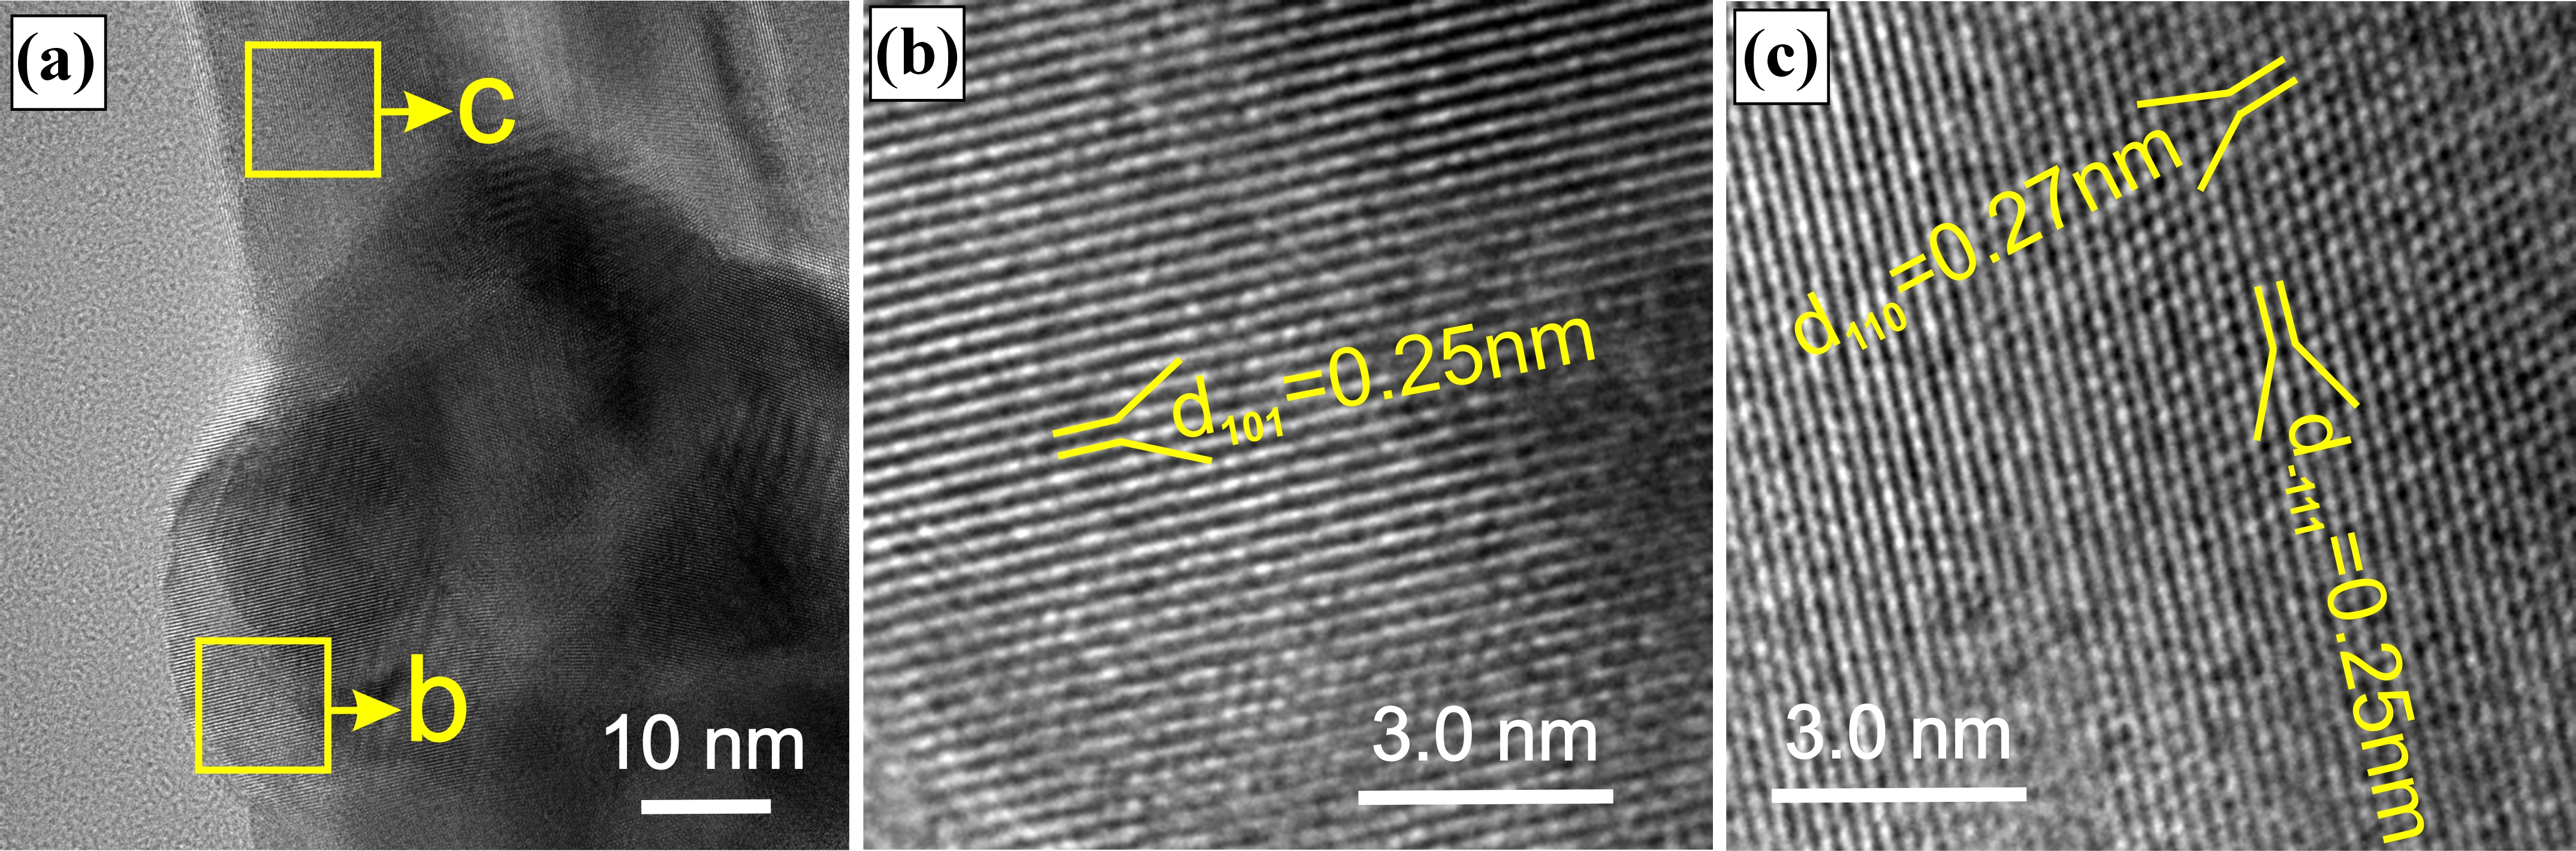
Fig. 8. TEM images of (a) CuO nanowire with ZnO nanostructure with the marked area of the analysis, (b) HRTEM with the measurement of the interplanar distance of ZnO, and (c) CuO.
Selected-area electron diffraction (SAED) further verified the coexistence of both phases [Fig. 9(a)]. HAADF imaging provided a strong contrast between the CuO and ZnO [Fig. 9(b)]. Elemental mapping showed that ZnO formed a uniform coating across the CuO nanowire surface. The clear localisation of Cu, Zn, and O in their respective regions confirmed a core–shell nanocomposite structure [Fig. 9(c)].
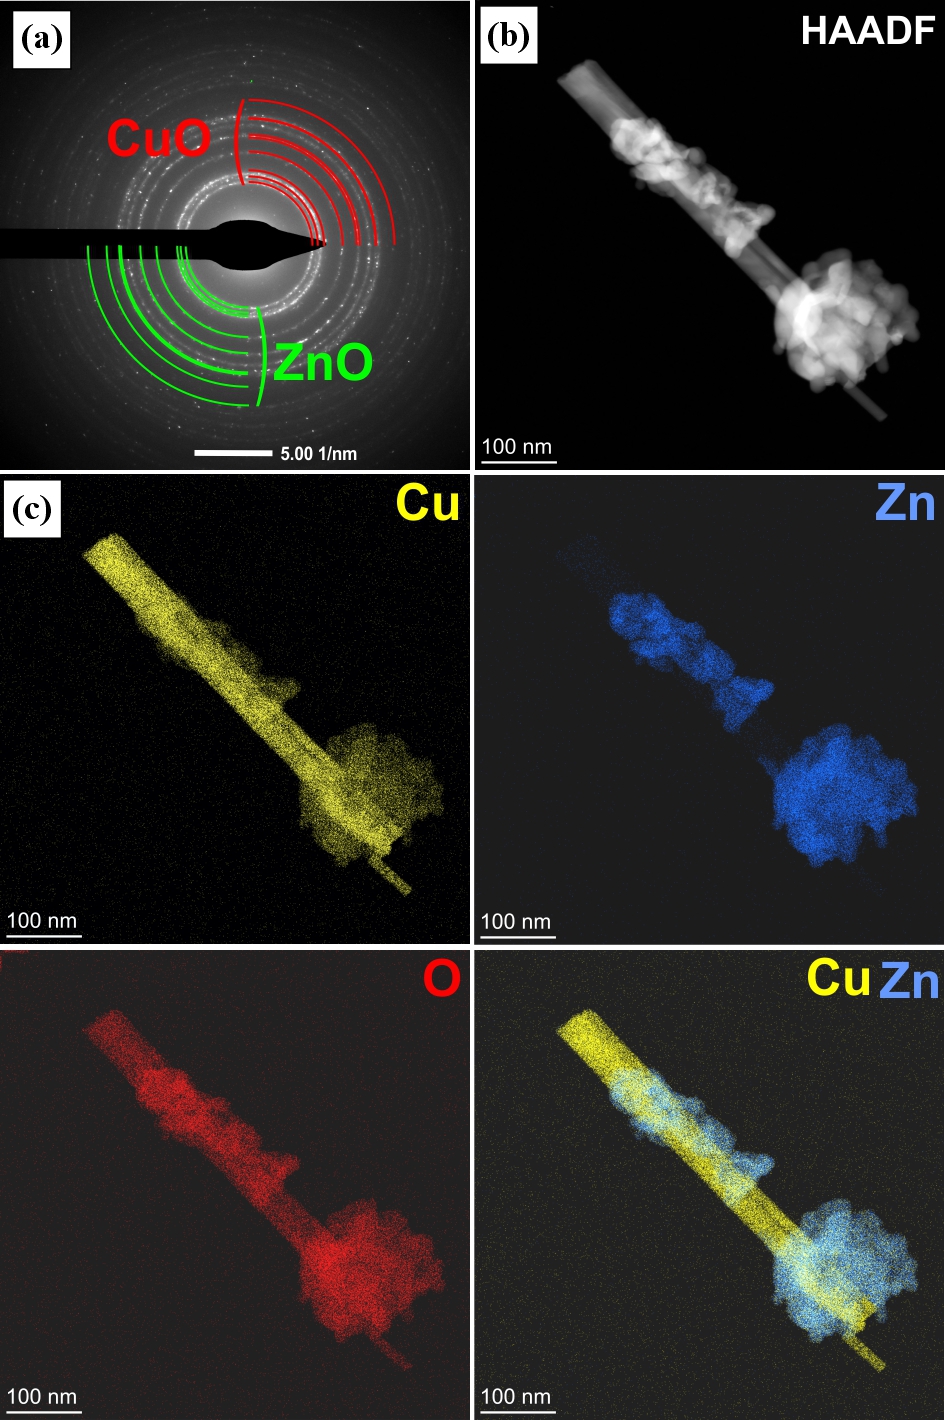
Fig. 9. (a) Electron diffraction pattern of the II type of nanocomposite, b) TEM images of a single CuO nanowire with ZnO nanostructures with material Z contrast in the HAADF mode, (c) EDS maps showing the distribution of Cu, Zn, and O.
3.3. Applications of nanocomposites based on Cu and Zn
The first type of nanocomposite, in the form of a nanobrass with ZnO nanofoam, demonstrated sensitivity to gases such as methane, hydrogen, and ammonia. The gas-sensing performance of the nanocomposite was evaluated by monitoring changes in its electrical resistance under controlled gas exposure conditions. For this purpose, silver contacts were deposited onto the sample surface and the sensor was placed in a custom-designed measurement chamber connected to a gas delivery system. During all gas-sensing experiments, the sensor operating temperature was maintained at 200 °C throughout the entire measurement process, including both gas exposure and airflushing stages. The temperature was actively controlled using a Shinko temperature controller, ensuring stable thermal conditions and minimising temperature-induced resistance fluctuations. Before gas introduction, the sensor was stabilised at 200 °C in air, and the resistance stabilised within approximately 250 s, after which a stable baseline resistance (R0) was achieved. Gas-sensing measurements were performed under a constant total gas flow rate of 50 mL/min for both the target gas mixtures and synthetic air. The gases were introduced into the chamber in a cyclic sequence of 5 min exposure to the target gas followed by 5 min flushing with air. This procedure ensured reproducible gas exchange conditions and allowed the evaluation of both sensor response and recovery behaviour. The percentage change in resistance due to exposure to a noxious gas was determined using the equation:

where R is the nanocomposite resistance measured during gas exposure, and R0 is the stabilised resistance measured in air.
Figure 10 presents the dynamic resistance response of the nanobrass/ZnO nanofoam sensor to methane (2% CH4/N2), hydrogen (2% H2/N2), and ammonia (100 ppm NH3/N2) at 200 °C. The maximum resistance changes reached 158% for methane, 131% for ammonia, and 91% for hydrogen. Upon switching back to air, the resistance returned close to its initial value, indicating good reversibility and effective sensor detoxification.
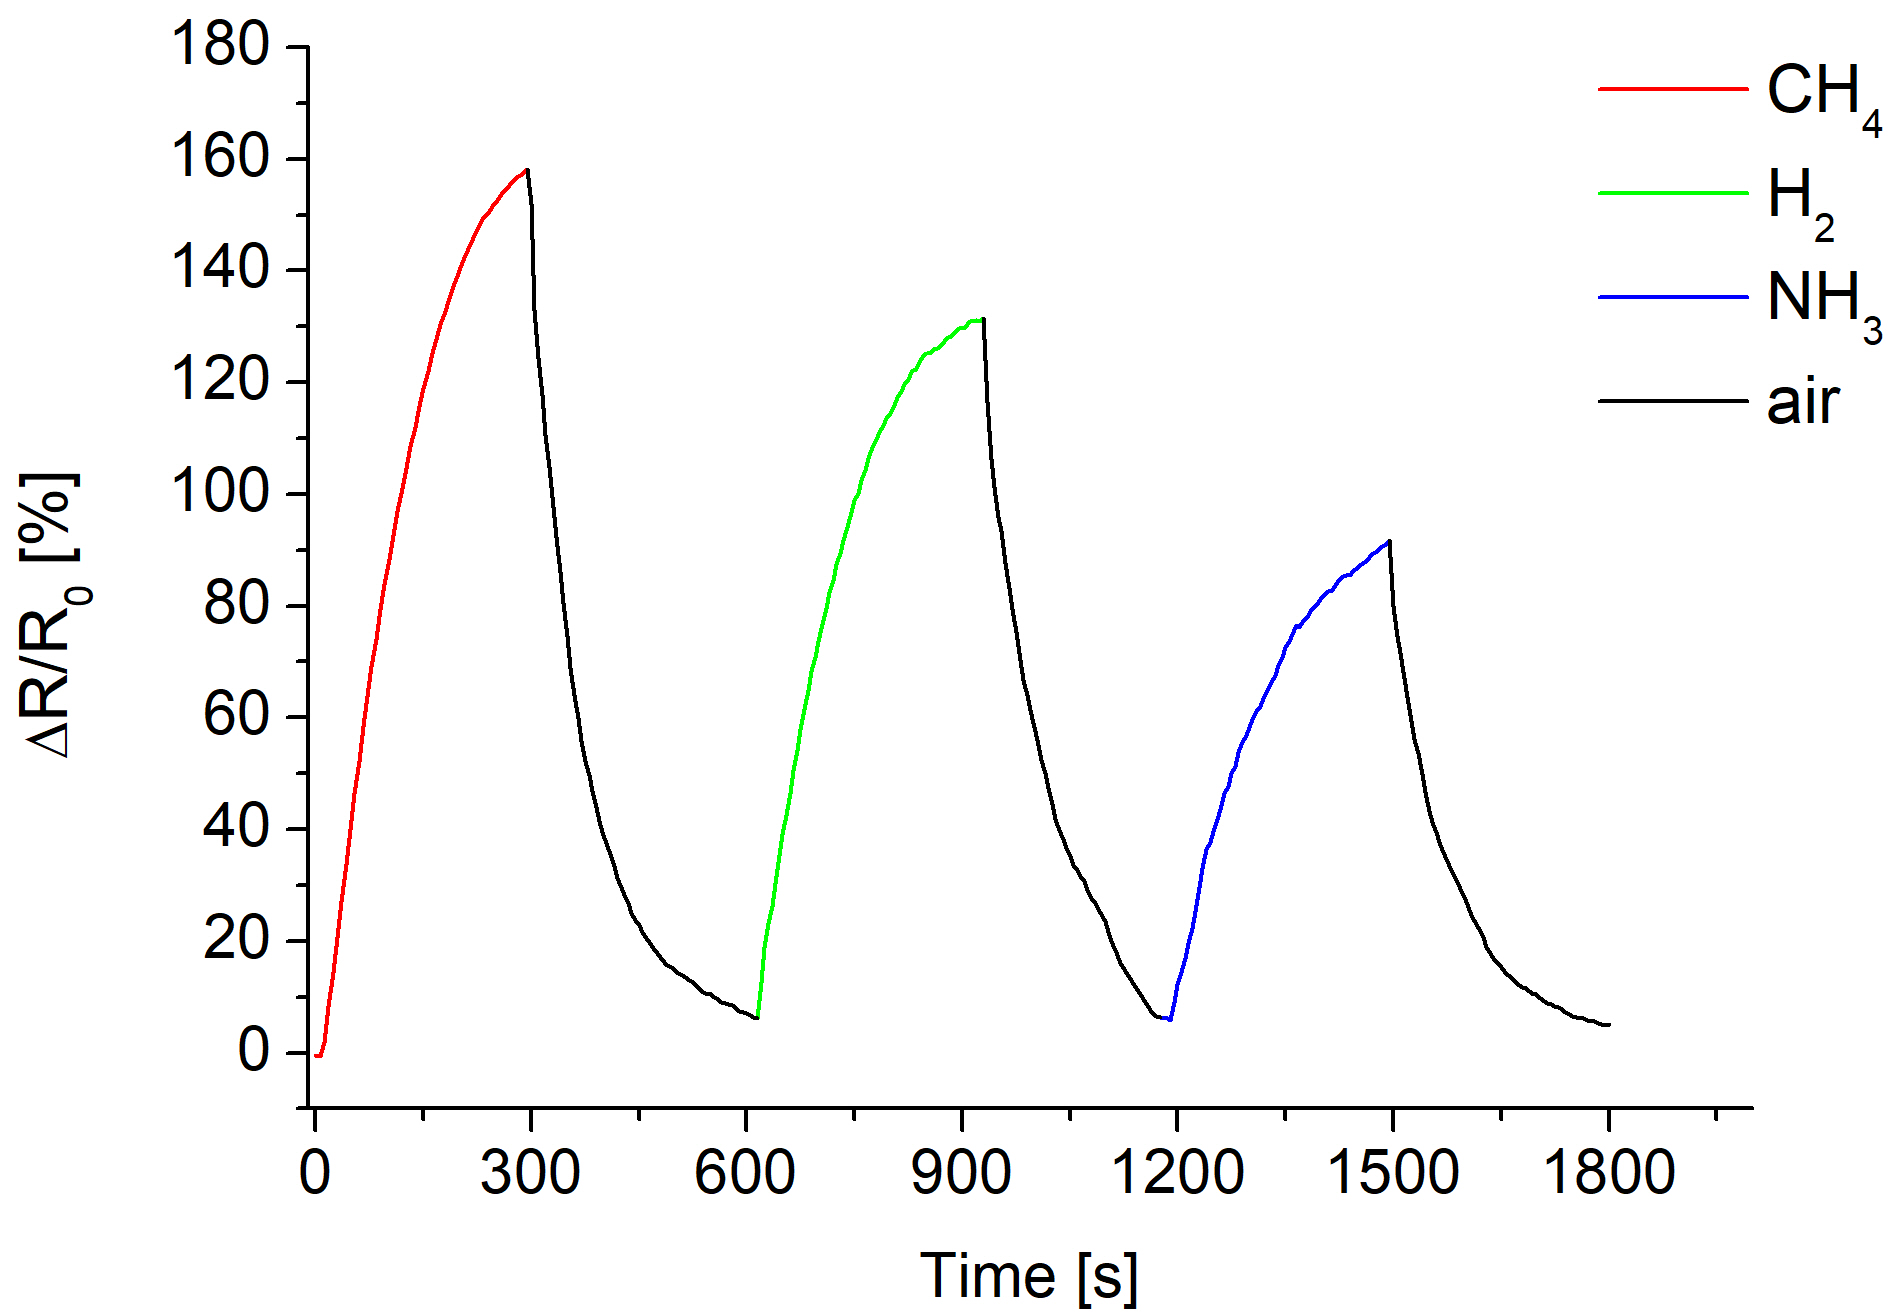
Fig. 10. The electrical resistance change of the I type of the nanocomposite, the nanobrass with ZnO nanofoam, to methane, hydrogen, and ammonia at 200 °C.
Importantly, the sensor response was found to be repeatable over successive gas/air cycles for all tested gases. Comparable ΔR/R0 values were obtained during repeated exposure–recovery sequences (CH4/Air, H2/Air, NH3/Air), with no evidence of irreversible poisoning or signal degradation. Minor variations between cycles were within experimental uncertainty and are typical for resistive-type metal oxide gas sensors.
It should be noted that during the selected gas exposure time (5 min), the resistance change shows a clear increasing or decreasing trend but does not always reach full saturation. This behaviour is attributed to adsorption– desorption kinetics and gas diffusion processes within the porous ZnO nanofoam structure. Longer exposure times would lead to a complete signal stabilisation, which is consistent with the behaviour commonly reported for porous metal oxide-based gas sensors.
The crucial role in the observed phenomenon of change in the nanocomposite resistance under the influence of gases is probably played by the top ZnO layer, which absorbs them. ZnO is an n-type semiconductor, and its porous structure provides a large active surface for gas adsorption. Gases such as CH4, H2, and NH3 interact with adsorbed oxygen species on the ZnO surface, decreasing the concentration of free electrons in the conduction band. This reduction in the charge-carrier concentration increases the overall resistance of the ZnO layer. The underlying nanobrass layer supports electron transport but does not prevent this surface-controlled sensing effect. As a result, the combined structure exhibits a noticeable rise in resistance when exposed to these gases.
The second type of nanocomposite, CuO nanowires with a ZnO nanostructure, exhibits photocatalytic properties. This activity was evaluated through the degradation of MB under natural sunlight. A 0.5 mg/100 mL aqueous MB solution was prepared, showing major initial absorption peaks at 613 and 663 nm. After adding the CuO-ZnO nanocomposite to the quartz reaction cell, UV-Vis spectra were recorded every few minutes from 500 to 800 nm. The results of photodegradation of the MB solution under the influence of sunlight and CuO-ZnO photocatalyst are shown in Fig. 11. In the spectra, a steady decrease in the MB absorption bands was observed, and after 120 min, they nearly disappeared, indicating strong photocatalytic degradation. A control experiment conducted under sunlight without the catalyst showed negligible selfdegradation of MB.
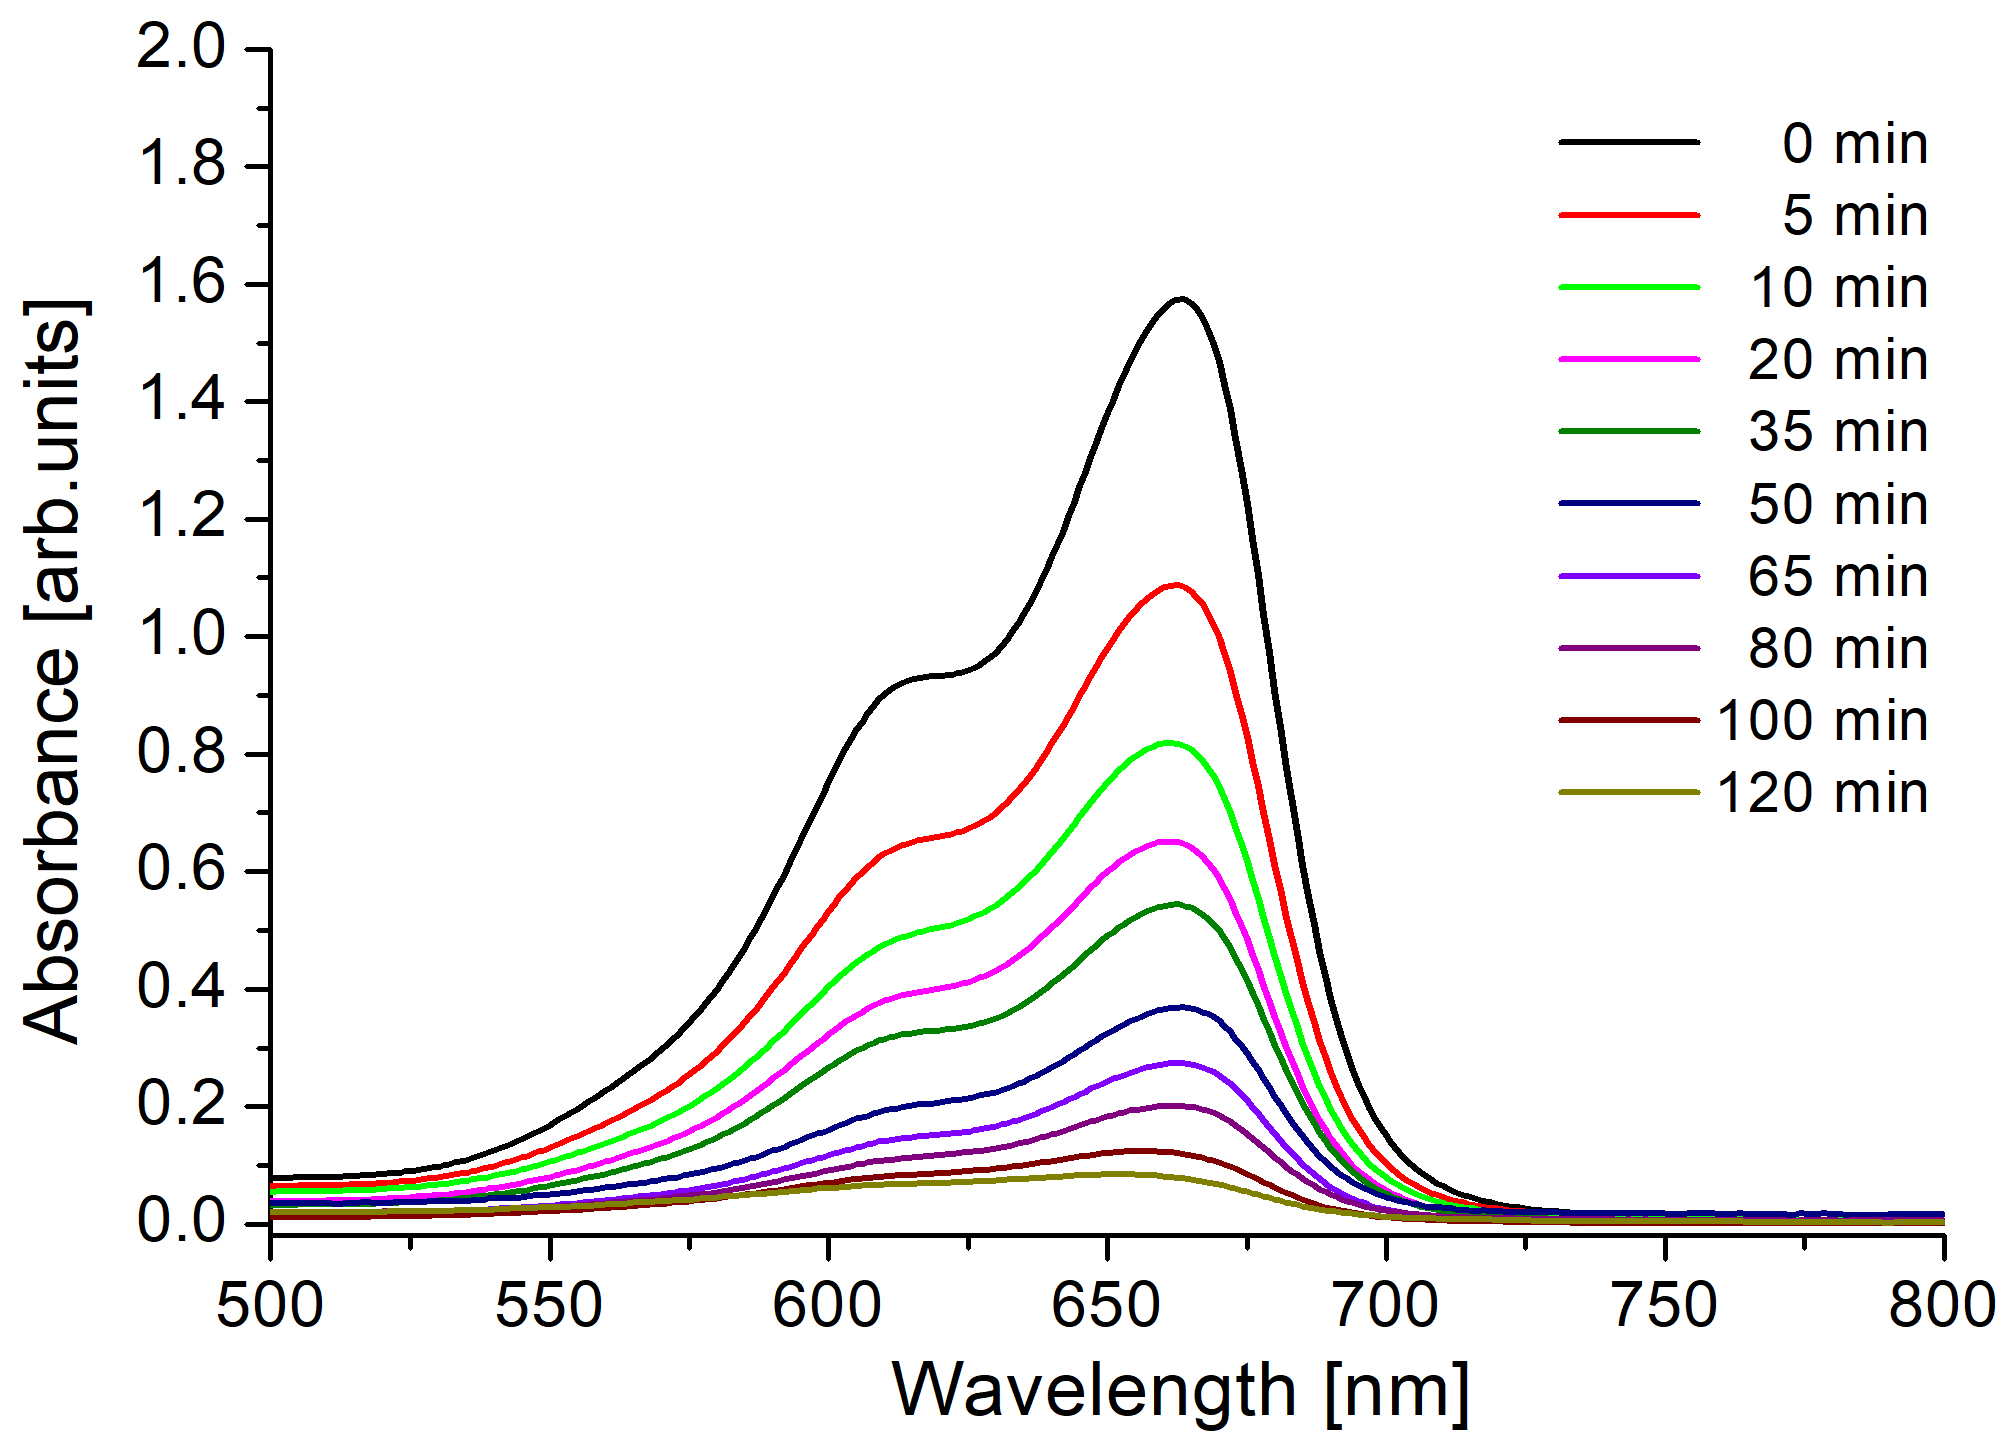
Fig. 11. The UV-Vis spectra of the photodegradation of the MB solution under the influence of sunlight and the CuO ZnO photocatalyst.
During the photodegradation of MB under sunlight in the presence of the CuO-ZnO photocatalyst, several coupled photochemical processes occur. When exposed to solar radiation, both ZnO and CuO absorb photons with energies equal to or greater than their band gaps. This excitation promotes electrons from the valence band to the conduction band, leaving behind positively charged holes.
The photogenerated electrons and holes then migrate to the nanocomposite surface, where they initiate redox reactions. Electrons react with dissolved oxygen molecules to form reactive oxygen species such as superoxide radicals (•O2⁻), while holes oxidise water or hydroxide ions to produce hydroxyl radicals (•OH). These radicals are highly reactive and capable of breaking down the MB dye molecules.
The CuO-ZnO heterojunction improves charge separation by facilitating electron transfer between the two oxides, reducing recombination and increasing the lifetime of reactive species. As a result, MB molecules adsorbed on the catalyst surface undergo successive oxidation steps, leading to the cleavage of their chromophoric structure and ultimately to mineralisation into CO2, H2O, and simple inorganic ions.
4. Conclusions
This study presents the synthesis of copper-zinc oxide nanocomposites with various morphologies via thermal oxidation and physical vapour deposition.
Both synthesis methods successfully produced welldefined CuO-ZnO nanocomposites with distinct architectures – porous nanofoam in the first case and nanowire-based hierarchical structures in the second. The combined SEM, XRD, HRTEM, HAADF, and EDS analyses confirm that:
-
The fabrication processes lead to crystalline multiphase materials.
-
ZnO is consistently and uniformly formed in both types of the nanocomposites.
-
The structural differences between the two composites are method-driven and can be exploited for applicationspecific surface area, diffusion, and optical/electronic properties.
-
The nanocomposite consisting of the porous ZnO layer on the surface and the Cu0.76Zn0.24 nanobrass bottom layer shows strong reactivity to gases such as methane, hydrogen, and ammonia.
-
The CuO-ZnO photocatalyst enhances sunlight-driven photodegradation of MB through efficient generation of reactive oxygen species and improved charge separation within the composite.
These properties enhance the potential applicability of the obtained nanocomposites in toxic gas sensor technologies and photocatalytic applications, making them promising candidates for environmental monitoring, detection, and water treatment systems.
Authors’ statement
Research concept and design, J.R., I.S.; collection, data analysis, and interpretation, J.R., I.S., M.K, R.D.; writing the article, J.R.; critical revision of the article, I.S.
Acknowledgements
This research was funded in whole by the National Science Centre of Poland, grant no. 2024/08/X/ST11/00837.
References
[1] Ma, Z. et al. Pressure-dependent band-bending in ZnO: A nearambient-pressure X-ray photoelectron spectroscopy study. J. Energy Chem. 60, 25–31 (2021). https://doi.org/10.1016/j.jechem.2020.12.018
[2] Hjiri, M. et al. Al-doped ZnO for highly sensitive CO gas sensors. Sens. Actuators B: Chem. 196, 413–420 (2014). https://doi.org/10.1016/j.snb.2014.01.068
[3] Shishiyanu, S. T., Shishiyanu, T. S. & Lupan, O. I. Sensing characteristics of tin-doped ZnO thin films as NO₂ gas sensor. Sens. Actuators B: Chem. 107, 379–386 (2005). https://doi.org/10.1016/j.snb.2004.10.030
[4] Sarala Devi, G., Bala Subrahmanyam, V., Gadkari, S. C. & Gupta, S. K. NH₃ gas sensing properties of nanocrystalline ZnO based thick films. Anal. Chim. Acta 568, 41–46 (2006). https://doi.org/10.1016/j.aca.2006.02.040
[5] Al-Hardan, N., Abdullah, M. & Aziz, A. A. The gas response enhancement from ZnO film for H₂ gas detection. Appl. Surf. Sci. 255, 7794–7797 (2009). https://doi.org/10.1016/j.apsusc.2009.04.180
[6] Rymarczyk, J. & Stępińska, I. CuO–ZnO nanocomposite for photocatalytic application. J. Vac. Sci. Technol. B 42, 032801 (2024). https://doi.org/10.1116/6.0003482
[7] Choi, J. D. & Choi, G. M. Electrical and CO gas sensing properties of layered ZnO–CuO sensor. Sens. Actuators B: Chem. 69, 120– 126 (2000). https://doi.org/10.1016/S0925-4005(00)00519-0
[8] Ushio, Y., Miyayama, M. & Yanagida, H. Effects of interface states on gas-sensing properties of a CuO/ZnO thin-film heterojunction. Sens. Actuators B: Chem. 17, 221–226 (1994). https://doi.org/10.1016/0925-4005(93)00878-3
[9] Das, S. & Srivastava, V. C. Synthesis and characterization of ZnO/CuO nanocomposite by electrochemical method. Mater. Sci. Semicond. Process. 57, 173–177 (2016). https://doi.org/10.1016/j.mssp.2016.10.031
[10] Terna, A. D., Elemike, E. E., Mbonu, J. I, Osafile, O. E. & Ezeani, R. O. The future of semiconductors nanoparticles: Synthesis, properties and applications. Mater. Sci. Eng. B: Solid-State Mater. Adv. Technol. 272, 115363 (2021). https://doi.org/10.1016/j.mseb.2021.115363
[11] Chakraborty, B. et al. Ultra-selective hydrogen sensors based on CuO-ZnO heterostructures grown by surface conversion. J. Alloys Compd. 1002, 175385 (2024). https://doi.org/10.1016/j.jallcom.2024.175385
[12] Poloju, M., Jayababu, N. & Ramana Reddy, M. V. Improved gas sensing performance of Al-doped ZnO/CuO nanocomposite based ammonia gas sensor. Mater. Sci. Eng. B 227, 61–67 (2017). https://doi.org/10.1016/j.mseb.2017.10.012
[13] Choi, M. S. et al. Selective, sensitive, and stable NO₂ gas sensor based on porous ZnO nanosheets. Appl. Surf. Sci. 568, 150910 (2021). https://doi.org/10.1016/j.apsusc.2021.150910
[14] Ciftyurek, E., Li, Z. & Schierbaum, K. Engineered porosity ZnO sensor enriched with oxygen vacancies enabled extraordinary subppm sensing of hydrogen sulfide and nitrogen dioxide air pollution gases at low temperature in air. Sensors 24, 7694 (2024). https://doi.org/10.3390/s24237694
[15] Ibn Mahrsi, M. et al. 0D/1D CuO-Cu₂O/ZnO p-n heterojunction with high photocatalytic activity for the degradation of dyes and naproxen. J. Environ. Chem. Eng. 12, 113072 (2024). https://doi.org/10.1016/j.jece.2024.113072
[16] Nisha, J., Remya Ampadi, R., Alphonsa, P., Saji, A. & Tina, S. p- CuI/n-ZnO heterojunction for enhanced dye degradation in water treatment. Solid State Commun. 406, 116192 (2025). https://doi.org/10.1016/j.ssc.2025.116192
[17] Kumari, V. et al. Synthesis and characterization of heterogeneous ZnO/CuO hierarchical nanostructures for photocatalytic degradation of organic pollutant. Adv. Powder Technol. 31, 2658– 2668 (2020). https://doi.org/10.1016/j.apt.2020.04.033
[18] Hosseini, S. M., Asadpour, S., Ghasemi, M. & Shirani, M. Efficient photocatalytic activity of ZnO/GO/CuO nanocomposite with solar light for reduction of hexavalent chromium. Sci. Rep. 15, 20780 (2025). https://doi.org/10.1038/s41598-025-05790-8
[19] Rashid, H. et al. Synthesis, structural and photocatalytic properties of ZnO-CuO, ZnO-graphene and ZnO-CuO-graphene nanocomposites. Polyhedron 273, 117471 (2025). https://doi.org/10.1016/j.poly.2025.117471
[20] Sivasakthi, S. & Gurunathan, K. Graphitic carbon nitride bedecked with CuO/ZnO hetero-interface microflower towards high photocatalytic performance. Renew. Energy 159, 786–800 (2020). https://doi.org/10.1016/j.renene.2020.06.027
[21] Hu, W. et al. Enhanced photocatalytic properties of CuO–ZnO nanocomposites by decoration with Ag nanoparticles. Ceram. Int. 46, 24753–24757 (2020). https://doi.org/10.1016/j.ceramint.2020.06.235
[22] Fernando, J. F. S. et al. Photocatalysis with Pt–Au–ZnO and Au– ZnO hybrids: Effect of charge accumulation and discharge properties of metal nanoparticles. Langmuir 34, 7334–7345 (2018). https://doi.org/10.1021/acs.langmuir.8b00401
[23] Bonthula, S. et al. Facile fabrication of Pd-doped CuO-ZnO composites for simultaneous photodegradation of anionic and neutral dyes. Physchem 4, 181–196 (2024). https://doi.org/10.3390/physchem4030014
[24] Ashar, A. et al. Enhanced solar photocatalytic reduction of Cr(VI) using a (ZnO/CuO) nanocomposite grafted onto a polyester membrane for wastewater treatment. Polymers 13, 4047 (2021). https://doi.org/10.3390/polym13224047
[25] Moradi, M. et al. CuO and ZnO co-anchored on g-C₃N₄ nanosheets as an affordable double Z-scheme nanocomposite for photocatalytic decontamination of amoxicillin. Appl. Catal. B: Environ. 285, 119838 (2021). - https://doi.org/10.1016/j.apcatb.2020.119838