Characteristics of vacuum ultraviolet emission from a laserplasma radiation source based on a gas-puff target
Martyna Wardzińska1*
Przemysław Wachulak1
Andrzej Bartnik1
Tomasz Fok1
Łukasz Węgrzyński1
Henryk Fiedorowicz1
Maciej Bzowski2
Marek Strumik2
Roman Wawrzaszek2
Jakub Mądry2
- Institute of Optoelectronics, Military University of Technology, ul. gen. Sylwestra Kaliskiego 2, 00-908 Warsaw, Poland
- Space Research Centre PAS (CBK PAN), ul. Bartycka 18A, 00-716 Warsaw, Poland
Article Info
Received 25 Aug. 2025
Received in revised form 01 Dec. 2025
Accepted 22 Dec. 2025
Available on-line 13 Feb. 2026
Keywords: vacuum ultraviolet (VUV) radiation; laser-plasma source; Lyman-α line; NASA IMAP mission; GLOWS photometer; VUV optics metrology.
Abstract
The growing interest insolar corona and heliospheric backscatter glow observations in the vacuum ultraviolet, along with technological advancements in the feasibility of vacuum ultraviolet optical components for such applications, underscores the need for improved metrological solutions.This workpresents a detailed characterisation of a compact laser‑produced plasma vacuum ultraviolet source based on a double-stream gas-puff target, relevant in the metrology of optical elements for space applications. The measurements include the source spectrum, the number of photons, and the source size for targets produced using different gases. Such a source was used to test optical components of the Lyman-alpha space-based observation systems and remains available for future metrology applications. To the best of our knowledge, this is the first application of alaser-produced plasma vacuum ultraviolet source for characterising space-relevant optical components.
1. Introduction
Vacuum ultraviolet (VUV) with wavelengths from 10 nm to 200 nm [1] has long been important in ultraviolet astronomy [2, 3]. Due to the fact that VUV radiation is completely absorbed in the Earth’s atmosphere, astronomical observation systems must be located in space. Comprehensive information on VUV astronomy and the equipment used to observe space objects and measure the radiation they emit can be found in the monographs mentioned above. An important area of VUV astronomy is the observation of the Sun and the heliospheric backscatter glow resulting from the fluorescence of neutral interstellar gas inside the heliosphere illuminated by the Sun [4, 5].
Such observations are used by astrophysicists to analyse solar activity, understand the impact of solar magnetic effects on developing planetary systems [6], study the effects of solar flares on Earth’s atmosphere [7], or investigate the composition and acceleration of the solar wind [8]. Lyman-α emission is used to observe the Sun, comets, and the heliosphere, as well as to study terrestrial and planetary atmospheres. Moreover, it is also important in many broader astrophysical contexts, including cosmological studies – for instance, its redshifted signature was used to discover a galaxy during the Epoch of Reionization, observed by the James Webb Space Telescope [9]. The Space Research Centre of the Polish Academy of Sciences (CBK PAN) in Poland designed a GLObal Solar Wind Structure (GLOWS) photometer [10] for NASA’s Interstellar Mapping and Acceleration Probe (IMAP) space mission [11, 12] to measure the glow from the interstellar hydrogen (H2). The instrument comprises a 122 nm narrowband filter (Teledyne Acton Optics, Acton, USA) to select the desired wavelength range. A highly absorbing Magic Black coating (Acktar, Kiryat Gat, Israel) was also applied to the inside of the instrument optical path to suppress reflections of stray light from the outside of the desired field of view.
Metrology and testing of observation and measurement systems components are crucial steps in the development of space experiments in the VUV spectral range [13]. Commonly used VUV radiation sources for such metrology include synchrotrons [14, 15], electron cyclotron resonance plasma sources [16], deuterium lamps [17], discharge-based
VUV sources [18], and laser-produced plasma (LPP) sources [19]. Although LPP sources cannot match the brightness and repeatability of synchrotrons, they remain a cheaper and more compact option for metrology. Moreover, they provide higher intensity than conventional discharge or deuterium lamps, which makes them a more practical option for laboratory VUV measurements.
In the past, LPP based on a gas target was used to characterise VUV radiation by performing spatial, spectral, and temporal analyses in the 100–260 nm range with different gases, such as Ar, He, Xe, and N2 [20]. The same group also characterised a source for a tunable singlephoton ionisation by measuring the plasma size and shape, calibrating the absolute intensity, and analysing the xenon emission spectrum in the 100–200 nm range [21]. Additionally, the spectral and temporal properties of the VUV source were studied in the 150–300 nm range using Ar, Kr, Ne, and He, confirming the potential of such sources for spectrophotometry and in time-resolved spectroscopy [22]. Detailed spectral studies of VUV radiation in the wavelength range of 123–164 nm using an LPP source based on a solid target, supported by computer simulations of the generated laser plasma, are presented in [23]. A maximum VUV radiation conversion efficiency of 3%/2π over this wavelength range was demonstrated.
In our work, we present for the first time a comprehensive characterisation of a compact LPP VUV source based on a double-stream gas-puff target, including its spectrum, number of photons, and source size in the wavelength range of 115–160 nm for targets produced from various gases, including xenon (Xe), krypton (Kr), argon (Ar), carbon dioxide (CO2), nitrogen (N2), and hydrogen (H2), hereinafter referred to by their chemical symbols. As an application example, we demonstrate a broadband LPP VUV source based on Xe for filter transmission measurements, confirming its novelty and suitability for characterising optical elements for space missions.
Although VUV sources have been studied by other authors, our group provides several novel contributions. High-resolution spectral characteristics, photon number in arbitrarily selected spectral bands and lines, and spatial size of the source for strong Kr and Xe lines are presented. Such an LPP-based source is optimised for space-related metrology.
2. Experimental setup
A photograph of the VUV source with an attached VUV spectrometer and the gas-puff target arrangement [panel (a)] and schematic diagrams of the experimental setup [panels (b) and (c)] are presented in Fig. 1. An Nd:YAG (λ = 1064 nm) laser system (EKSPLA, Vilnius, Lithuania) was used to generate laser plasma. Laser pulses with an energy of approximately 6–7 J and a duration of 1–3 ns were focused on a double-stream gas-puff target [24, 25] using an f = 100 mm lens. The target was created with an electromagnetic valve system equipped with two coaxial nozzles. The working gas from which the plasma is generated (Xe, Kr, Ar, N2, CO2, H2) is injected through the inner nozzle with a diameter of 0.4 mm. While the low-Z buffer gas (He), which confines the working gas and forms an elongated gas jet, flows out through the outer nozzle in the form of a ring (dimensions of 0.7 × 1.5 mm2).
A diagram of the double gas-puff target is shown in Fig. 1(a). For a proper operation, a laser-target synchronisation is required [26]. The characterisation of the opening and closing times of the valves is described in the further part of the paper.
VUV radiation measurements were performed using two variants of the experimental setups. A setup for spectral measurements is presented in Fig. 1(b). The setup consisted of a spectrometer (HP Spectroscopy GmbH, easyLIGHT VUV, Germany) based on a concave flat-field varied-linespace diffraction grating (1200 grooves/mm, incidence angle of 51.9°) with an adjustable wavelength range from 40 nm to 280 nm, a 100 µm-wide entrance slit. A CCD camera (Andor DO920P-BEN, Oxford Instruments, USA) with a chip size of 1024 × 255 pixels, pixel size of 26 × 26 µm[2] was employed. The exposure time was 3 s. The camera was cooled to −20 °C during all measurements to minimise the impact of internal noise and background. The wavelength axis of the spectrometer was calibrated using carbon (C III at 117.493 nm and C IV at 154.820 nm), N2 (N V at 123.880 nm and 124.280 nm, and N I at 149.263 nm), H2 (Lyman-α at 121.567 nm), and oxygen (O I at 130.217 nm) lines. To cut off the wavelengths below 110 nm, a lithium fluoride (LiF) filter was used.

Fig. 1. Panel (a) shows a photograph of the VUV source with an attached VUV spectrometer and the gas-puff target arrangement. The experimental setup used for characterising VUV radiation, presented in two variants for measuring: (b) spectra and (c) photon numbers.
To measure the number of photons, the setup [Fig. 1(c)] was modified by replacing the spectrometer with a pinhole of a diameter of 500 µm. The pinhole was positioned 32 cm downstream of the source. An AXUV 100 Si photodiode (International Radiation Detectors, Inc., USA) was used, biased to −30 V DC. To capture the pulses, an oscilloscope (SDS2354X Plus, SIGLENT Technologies, China) was employed. In this case, an additional filter (UV fused silica – UVFS) was needed to ensure that the number of photons was measured only in the analysed range below 170 nm. This filter, along with the LiF filter, was placed on a filter wheel between the pinhole and the photodiode. Additionally, the beam was directed through a black shielding sleeve to eliminate any effects of spurious reflections or stray radiation.
Since the source size needs to be measured in a welldefined spectral range, a spectrometer is required, as shown in Fig. 2. These measurements involved determining the horizontal and vertical sizes. Both setups were equipped with the horizontal slit (width d = 80 µm) and the LiF filter. The magnification in the first setup [Fig. 2(a)] was equal to 4. In the second setup [Fig. 2(b)], the beam was rotated with the use of two reflective silicon mirrors allowing for observation of the source size along the other axis (in an orthogonal direction). In this setup, the magnification was equal to 2.7. The beam orientation after the horizontal slit in both measurements is shown in Fig. 3.
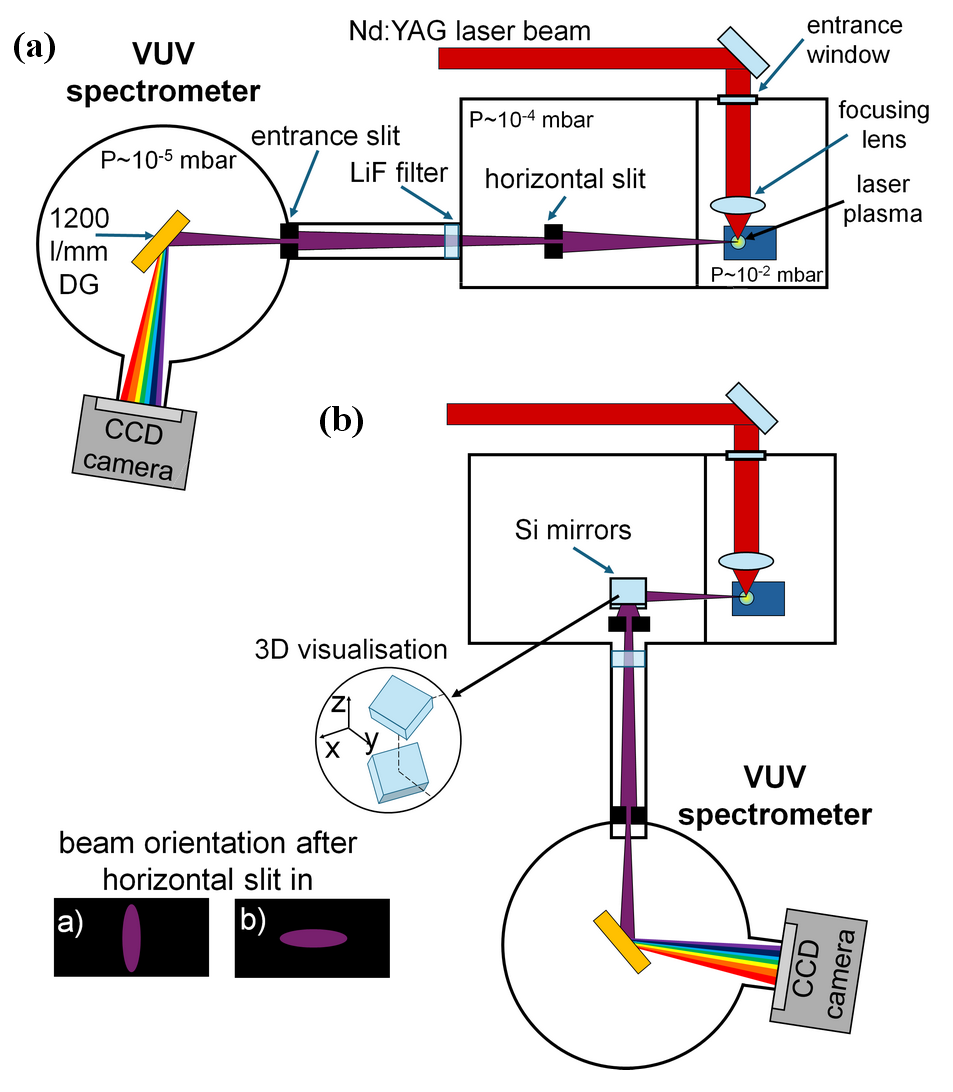
Fig. 2. Experimental setup used for the measurements of the source size: (a) vertically and (b) horizontally by rotating the beam with the use of two Si mirrors.
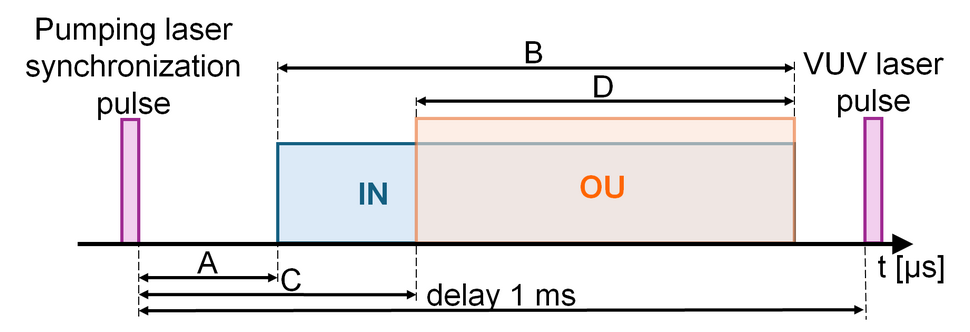
Fig. 3. Visual representation of nozzles opening and closing times.
3. Experimental results
3.1. Optimisation of gas-puff target synchronisation
Before starting the source characterisation measurements, it was necessary to optimise the synchronisation of the gaspuff target with the laser pulse. For this purpose, four parameters were considered: parameter “A” represents the time between receiving the synchronisation pulse from the laser power supply and opening of the inner nozzle (IN), which remains open for the time defined by parameter “B”. Parameter “C” denotes the time between receiving the synchronisation pulse and opening the outer nozzle (OU), with the nozzle remaining open for the time specified by the parameter “D”. Visual representation is shown in Fig. 3.
Measurements were taken of the dependence of VUV emission for selected gases as a function of the opening and closing times of gas nozzles relative to the laser pulse. Example results for Ar are shown in Fig. 4. The measurements showed the highest intensity for parameter values A = 200 μs, B = 750 μs, C = 400 μs, and D = 550 μs. The delay between the synchronisation pulse and the laser pulse was always equal to 1 ms. The presented results were obtained by integrating 255 consecutive CCD lines (rows) from five images, each containing data accumulated from five VUV source pulses.
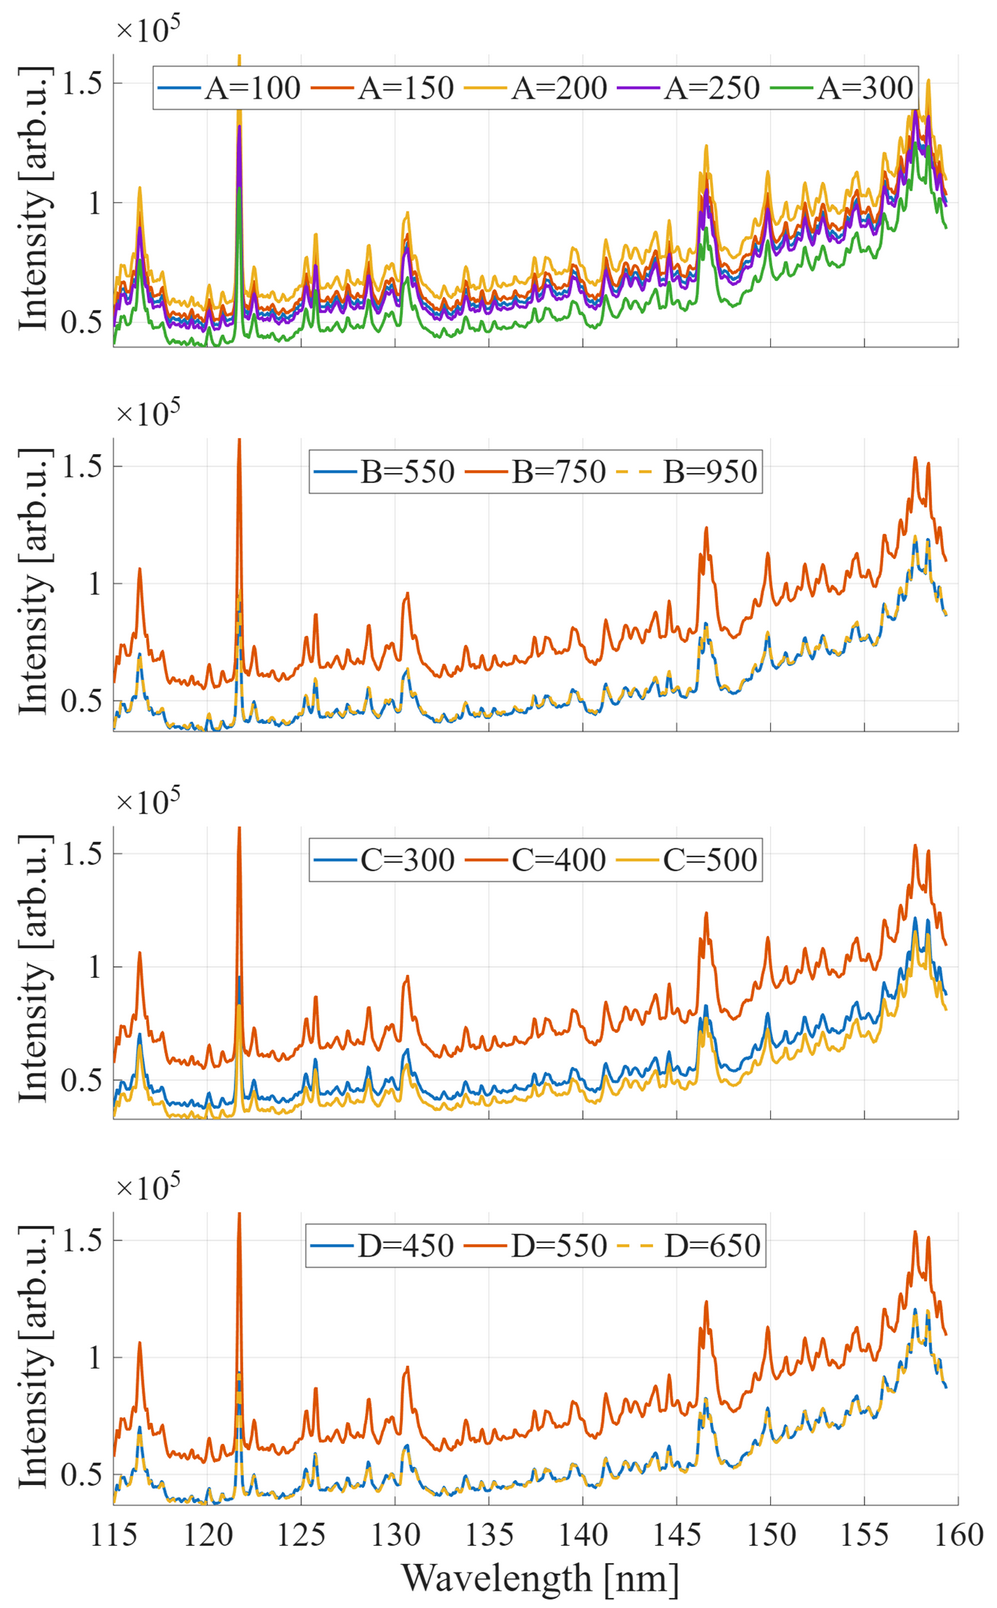
Fig. 4. Results of measurements of the opening and closing times of the nozzles and their influence on the signal intensity. The characterisation was conducted for Ar. All A, B, C, and D values are in [µs] (see text for more details).
3.2. Optimisation of the gas-puff target in terms of the working gas pressure
With the target timings optimised for the highest spectral emission, the influence of gas pressure on the plasma emission intensity was also investigated. The spectra of these gases were studied to determine how changing the gas pressure affects intensity and identify the pressure at which the intensity is the highest. Furthermore, the pressure of the buffer gas, helium, was examined to identify its influence on the spectra. The results showed that the optimal helium pressure is 6 bar. For H2, a single-stream gas-puff target was used, as H2, being a light gas, naturally plays a stabilising role similar to that of helium for heavier gases.
Example results of the VUV spectral measurements for the selected working gases (CO2, N2, and H2) and for different backing pressures are shown in Fig. 5. Several strong spectral lines were selected for intensity comparison. The spectra are shown in blue in panels (a), (c), and (e), and the corresponding plots in panels (b), (d), and (f) illustrating the influence of changing gas pressure on the peak intensity of the selected lines. The standard deviation of the peak intensity was estimated as 1.5–2%. This correlation was analysed for each gas, but only those with well-defined spectral lines are presented. One of the most noticeable trends is the quasi-linear increase in intensity with increasing working gas pressure. It can be expected that the intensity will stabilise at a certain pressure [27]. Therefore, further analysis was conducted for maximum working gas pressures, typically 8–10 bar, depending on the gas used.
The data acquisition process in this section was similar to that used in the target synchronisation optimisation study presented above.
3.3. Spectral measurements
For optimal gas pressures and optimised target timing, spectra for different gases – Xe, CO2, Kr, N2, Ar, and H2 – were measured, as presented in Fig. 6. For heavier (higher Z) gases, such as Xe, Kr, and Ar, the spectra were very bright due to the numerous spectral lines resulting from multiple electronic transitions (transition arrays). Those denote groups of spectral lines produced by many closely spaced electronic transitions in atoms.
For lower-Z and molecular gases, such as CO2, N2, and H2, individual spectral lines were easier to distinguish. It is worth noting that the Lyman-α line is visible and very strong for H2. The spectra presented here were acquired in the same way as described for the previous results. All the spectra presented in this paper are corrected for the LiF filter transmission.
3.4. Photon number
The next part of the measurements focused on determining the VUV signal intensity by calculating the photon number. LiF and UVFS filters were used to narrow the wavelengths to the desirable range below 170 nm. The filter transmissions are presented in Fig. 7.
To specify the photon number in the entire wavelength range measured, equation (1) was used. The number of photons was calculated as the difference between the integrals of the oscilloscope voltage traces obtained with the LiF (U LiF, in volts) and UVFS (U UVFS, in volts) filters, divided by the oscilloscope input impedance R, the quantum efficiency of the photodiode QE, and the elementary charge qe :

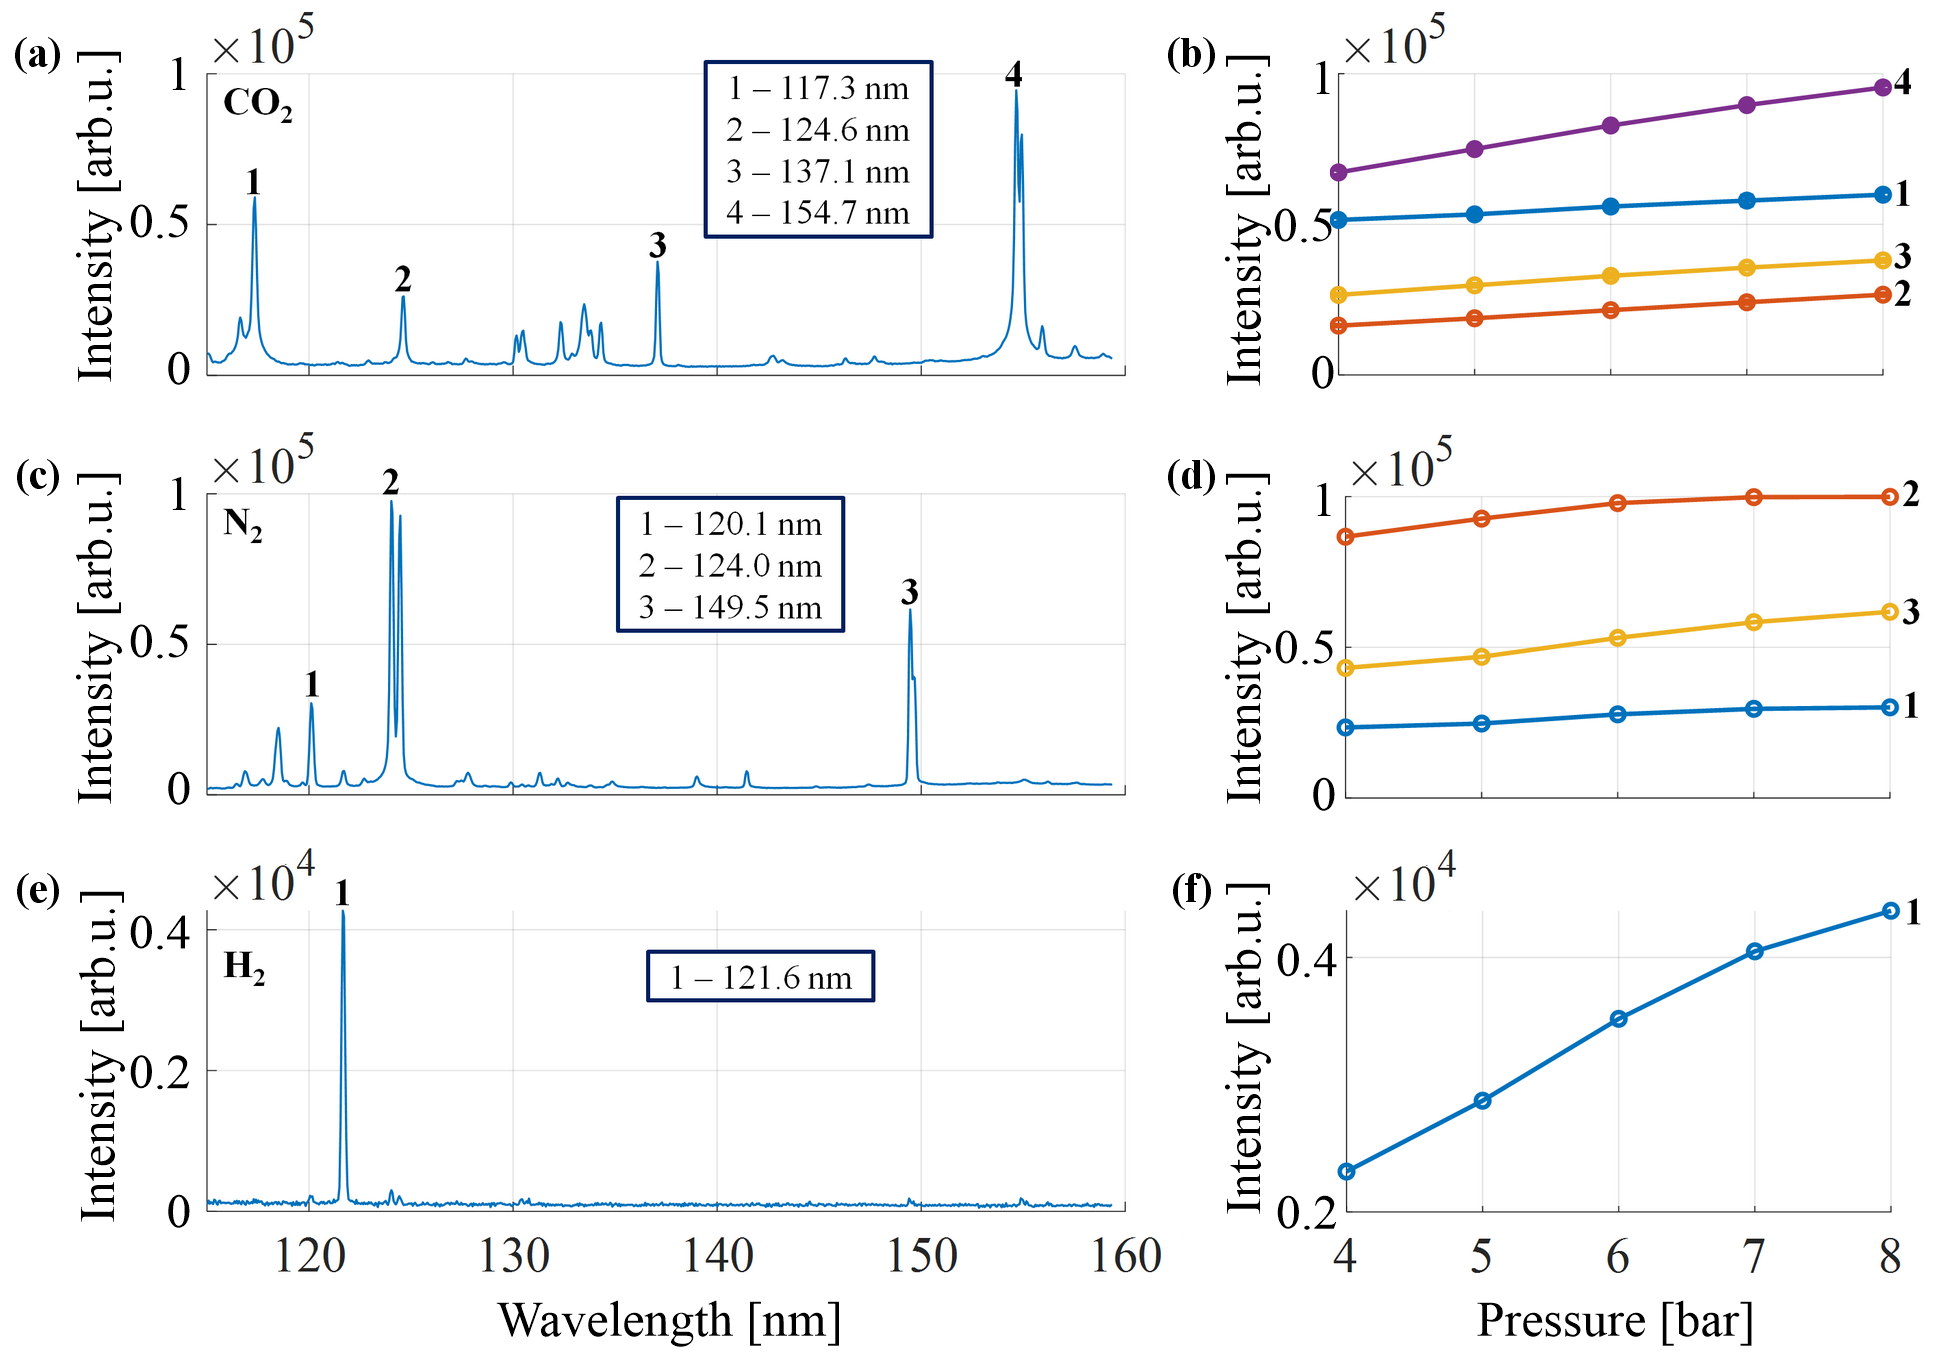
Fig. 5. Comparison of the intensity in the selected spectral lines for (a) CO₂, (c) N₂, and (e) H₂. Corresponding peak intensities as a function of gas pressure are shown in panels (b), (d), and (f). The standard deviation of the peak intensity was estimated as 1.5–2%.
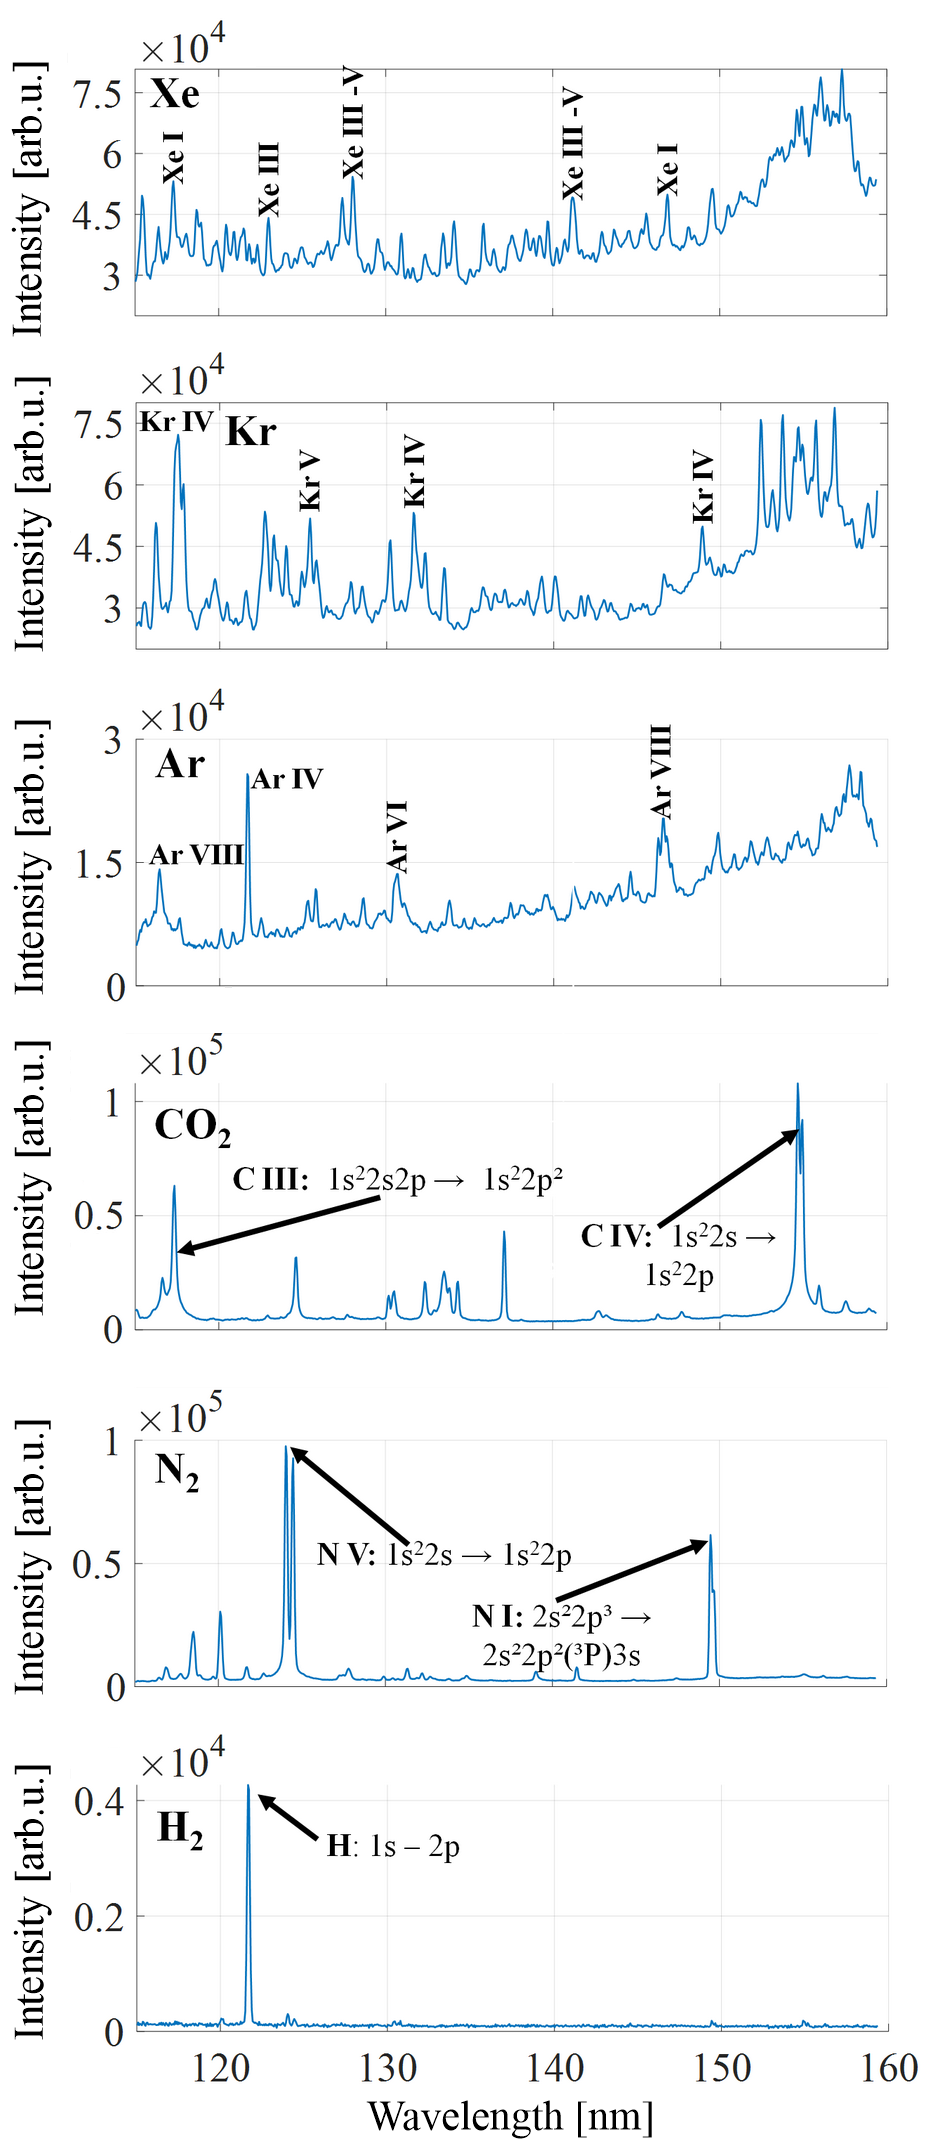
Fig. 6. Spectra of the analysed gases in the 105–160 nm wavelength range: Xe, Kr, Ar, CO2, N2, and H2. The selected lines were identified using the NIST Database [28].
To properly scale the photon signal [see (2)] in the spectral domain, the obtained number of photons was multiplied by the function c (λ). This function is a VUV spectrum (see section 3.3), with the area under the curve normalised to unity. The QE (λ) value varied for the respective wavelengths according to the manufacturer’s data [31]:

The results for the arbitrarily chosen spectral bands/lines, as indicated in Fig. 8, for various working gases are shown in Table 1. The H2 data were not included due to the very
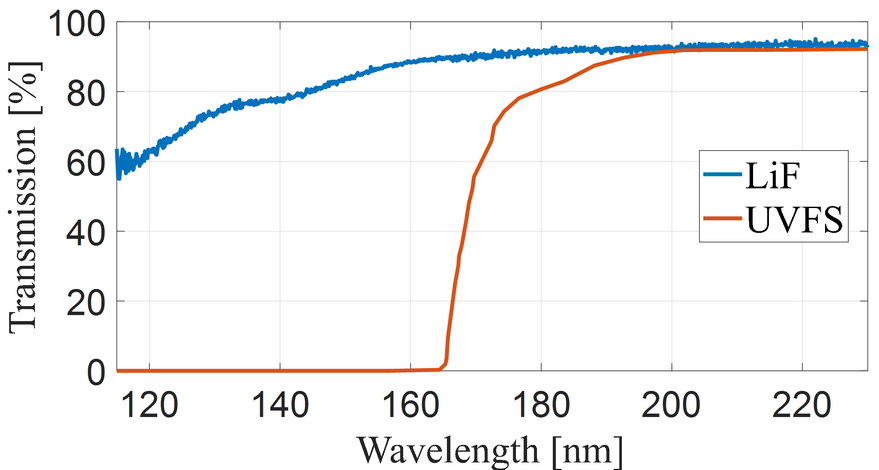
Fig. 7. The filter transmission LiF and UVFS. Data based on [29, 30].
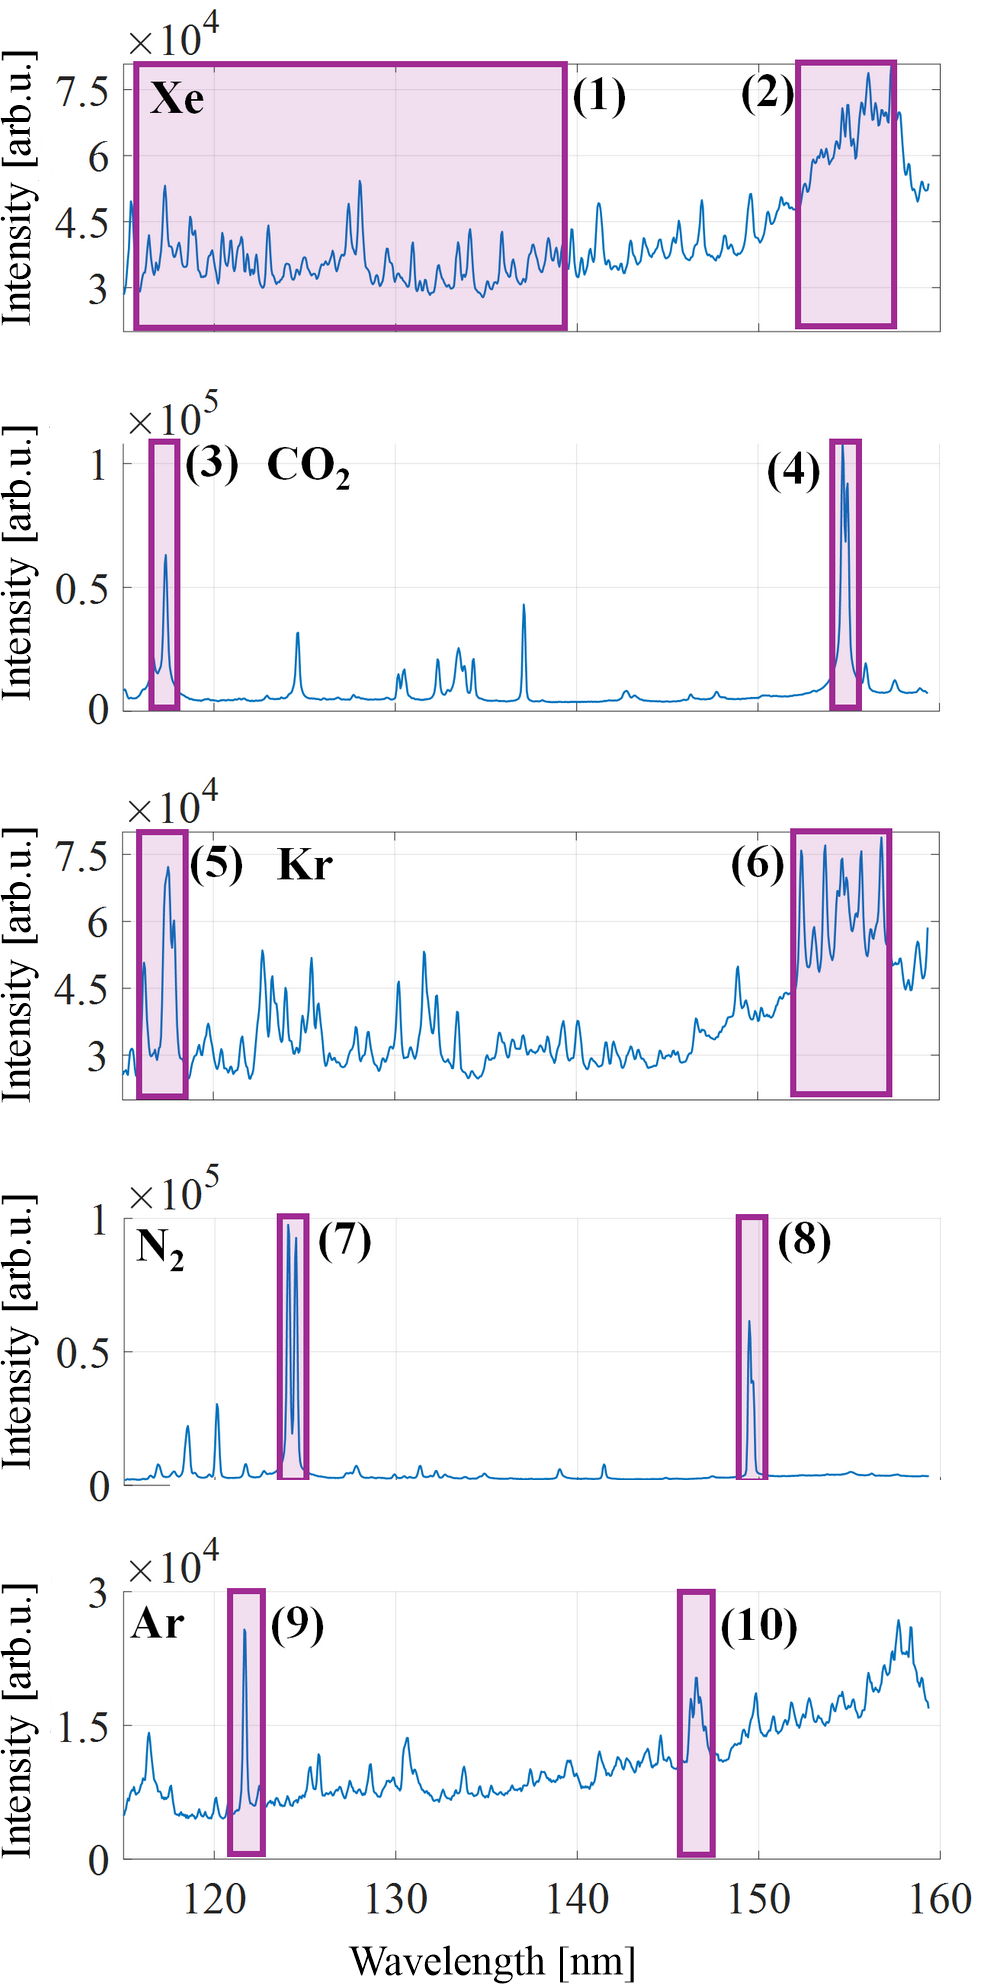
Fig. 8. Visualisation of the arbitrarily selected wavelength ranges and spectral lines/bands employed to calculate the number of photons.
low signal, which was undetectable by the photodiode used. The number of photons captured by the photodiode and shown in Table 1 is averaged from 16 VUV source pulses. The uncertainty values represent the standard deviation derived from the oscilloscope. The errors exceed 30%. They are caused by shot-to-shot fluctuation of the VUV source energy.
The number of photons for selected spectral lines and bands.
| Band number | Used gas | Number of photons per pulse* |
|---|---|---|
| 1 | Xe | 1.97 ± 0.73 · 108 |
| 2 | Xe | 2.08 ± 0.77·108 |
| 3 | CO2 | 7.61 ± 2.33 · 106 |
| 4 | CO2 | 1.83 ± 0.56 · 107 |
| 5 | Kr | 2.55 ± 0.91 · 107 |
| 6 | Kr | 1.51 ± 0.54 · 108 |
| 7 | N2 | 7.57 ± 2.32 · 106 |
| 8 | N2 | 3.32 ± 1.02 · 106 |
| 9 | Ar | 2.91 ± 0.99 · 106 |
| 10 | Ar | 8.85 ± 2.99 · 106 |
*per laser pulse (E=6.9–7.1 J, t=2.0–2.6 ns)
3.5. Source size
The final series of measurements were conducted to determine the size of the plasma source – in two orthogonal directions. To define the vertical and horizontal dimensions, several spectral lines were selected, and their intensity profiles were plotted as a function of size. The full width at half maximum (FWHM) was then determined to characterise the spatial distribution.
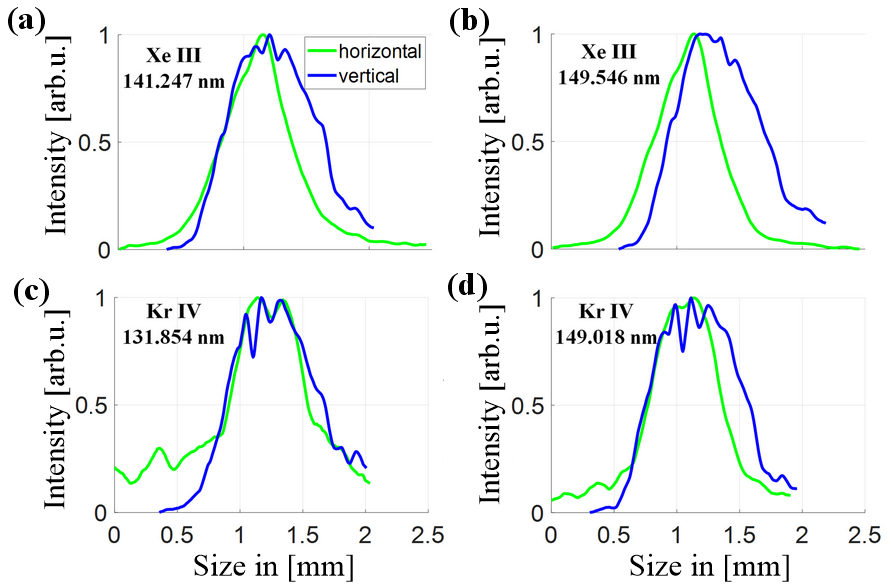
Fig. 9. Comparison of the horizontal and vertical sizes of plasma source for the spectral lines: Xe III (a) 141.247 nm and (b) 149.545 nm line, and Kr IV (c) 131.854 nm, and (d) 149.018 nm.
Figure 9 presents the results for two gases: Xe and Kr. The use of a second horizontal slit significantly reduced the signal intensity of the other lower-Z gases, making their measurement unreliable. The following spectral lines were selected for source characterisation:
Xe III transitions:
-
127.282 nm (5s5p⁵ → 5s²5p³(²P°)6p),
-
141.247 nm (5s²5p³(²D°)5d → 5s²5p³(²D°)4f),
-
149.545 nm (5s²5p³(⁴S°)5d → 5s²5p³(²D°)4f).
and Kr IV:
-
131.854 nm (4s²4p²(³P)4d → 4s²4p²(¹D)5p),
-
149.018 nm (4s²4p²(³P)4d → 4s²4p²(¹S)5p).
The corresponding values are shown in Table 2. The detector-limited uncertainty values were estimated to be ±10 µm, due to a discrete nature of the measurement with a 26 µm pixel detector, taking into account the magnification, as follows:

The FWHM plasma size for Xe and Kr, H – horizontal, V – vertical.
| Gas | Wavelength | FWHM [mm] | |
|---|---|---|---|
| H | V | ||
| Xe | 127.282 nm | 0.61±0.03 | 0.75±0.01 |
| 141.247 nm | 0.58±0.01 | 0.85±0.01 | |
| 149.545 nm | 0.55±0.02 | 0.81±0.01 | |
| Kr | 131.854 nm | 0.66±0.09 | 0.80±0.01 |
| 149.018 nm | 0.64±0.04 | 0.84±0.02 | |
The measured data, shown in Fig. 9, indicate that the plasma source was consistently larger in the vertical direction than in the horizontal direction. The oscillations observed in the vertical measurements are artifacts caused by the varying profile of the horizontal slit (see Fig. 3). To improve data quality, a median filter and a moving mean were applied for smoothing, however, with careful consideration to avoid affecting FWHM. The intensity profiles were normalised. The standard deviation was calculated from a series of ten images captured for each measurement, with each image representing an accumulation of data from ten pulses of the VUV source. The vertical data appear clipped due to limitations of the CCD sensor.
4. Example of application of a broadband Xe/He VUV source for filter transmission characterisation
The VUV source was employed in a series of measurements of the VUV neutral density filters, which were later used to calibrate the IMAP/GLOWS photometer described in the introduction section. The filters were coated with a UV-grade MgF2 coating (Teledyne Acton Optics, USA).
The setup consisted of a laser plasma source based on Xe/He gas-puff target (with the gas pressures of 9 bar for Xe and 6 bar for He). A LiF filter and the spectrometer were employed, operating in two overlapping spectral ranges (105–160 and 130–190 nm wavelengths). Measurements were performed separately for each of these two ranges. To obtain transmission data, two sets of measurements were required for each filter – one with the neutral density filter and one without it. For each filter, five spectra were collected, each representing the accumulation of data from a series of 20 VUV source pulses. These five spectra were then integrated during data processing. Subsequently, the data collected with and without the filter were divided to determine the transmission value as a function of wavelength.
Data were collected for filters with expected peak transmission of no less than 10% (FND1-1D-V – referred to as “GF”) and no less than 1% (FND2-1D-V – referred to as “ND”). The results shown in Fig. 10 present matched data from two spectrometer settings (105–160 nm – green line, and 130–190 nm – purple line). Transmission exhibits a peak around 120–130 nm, followed by a gradual decrease and stabilisation at longer wavelengths. These results are consistent with the manufacturer’s coating curves [33] and with the characteristics of a neutral density filter.
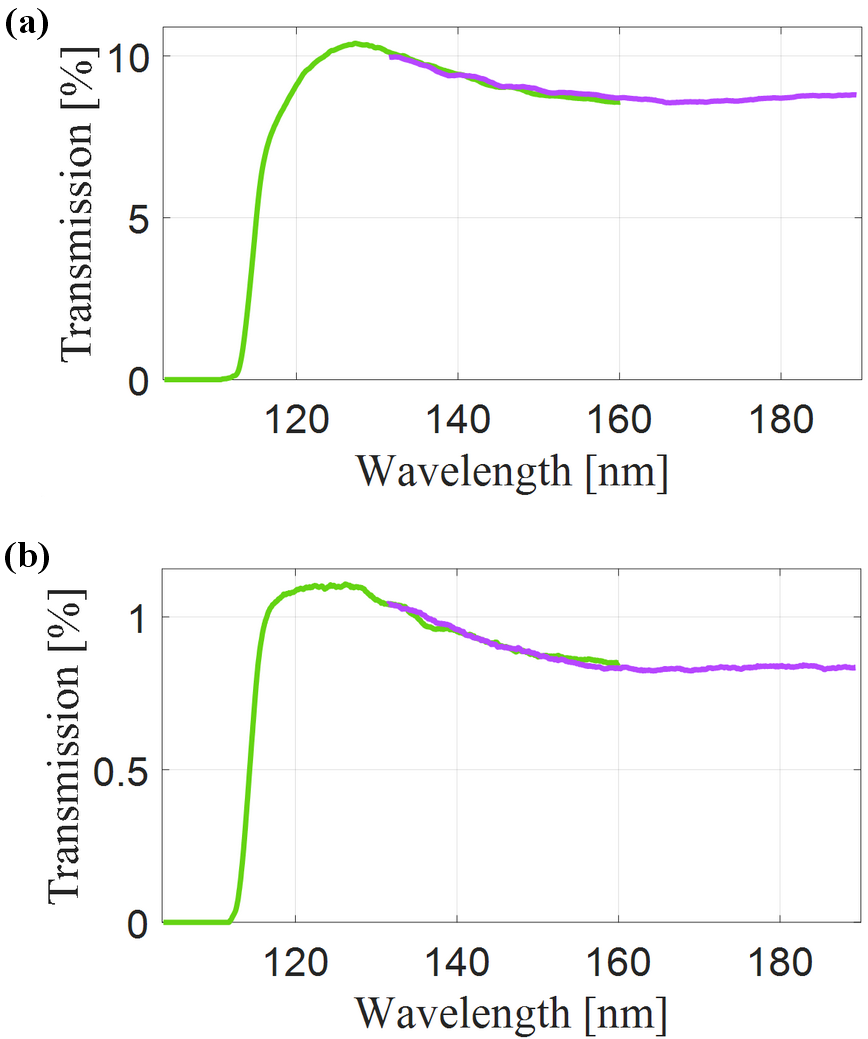
Fig. 10. Transmission measurement results for the VUV neutral density filter with a maximal peak transmission of (a) 10% – GF filter and (b) 1% – ND filter [32].
5. Discussion
Optimisation of the experimental setup maximised signal intensity. Spectral measurements of Xe, Kr, Ar, CO2, N2, and H2 revealed distinct emission profiles suitable for various applications. This indicates that heavier gases can be used for experiments requiring a broader, richer spectral emission, i.e., filter transmission characterisation. The lighter gases are needed for measurements demanding a more monochromatic radiation. The analysis presented was performed with spectral resolution of λ/Δλ ∼600, specified for H2 line at 121.6 nm. This indicates that the spectral “miscalibration” is of the order of Δλ/λ ~0.16%.
In general, the number of photons in a band is greater than in a single line, but for monochromatic applications, information on the number of photons in a line can also be vital (e.g., in microscopy systems based on diffractive optics). Generally speaking, high-Z gases, i.e., Xe and Kr produce broadband emission, which can be used in metrology and characterisation of materials, while low-Z gases, such as CO2 and N2, produce more monochromatic radiation from narrow spectral line emissions, see Table 1.
Characterisation of the source size revealed consistent anisotropy between the vertical and horizontal dimensions. In the investigated spectral region, the source exhibited a larger vertical than horizontal extent, whereas in the extreme ultraviolet (EUV, λ =10–121) [1] region, the opposite trend was observed, with the source appearing broader horizontally, i.e., 0.75×0.38 mm2 (FWHM) [34].
This difference indicates a wavelength-dependent shift in the spatial emission profile. The gas-puff target consists of a central stream of the working gas surrounded by a helium flow. One part of the radiation originates from the central region of the plasma focus and refers to the short wavelength range. In contrast, the less energetic radiation is mostly produced in the surrounding plasma region, associated with photoionization processes. Since gas flow is elongated vertically, as discussed in [25], the VUV source size is larger in the vertical direction and limited by the width of the gas stream. This geometrical effect leads to the observed anisotropy, which differs from that observed in EUV/SXR.
The uncertainty estimation presented in this paper is mostly influenced by a shot-to-shot fluctuation of the VUV source energy, of the order of approx. 30% (Table 1), related to the mechanical repeatability of the gas-puff valves, as well as the laser pulse stability [both energetic (~1%) and temporal (~9%)], as mentioned in Table 2.
Experimental results demonstrate a significant enhancement to the work of Di Palma and Borghese [20], resulting in higher spectral (~0.2 nm vs. 3 nm) and spatial resolutions (~10–20 μm vs. ~100–200 μm).
6. Conclusions
In summary, the laser-plasma VUV source was characterised by determining its spatial, spectral, and energy properties. The presented example of space-filter transmission measurements demonstrated the potential of the proposed compact, cost-effective VUV source for metrology applications, including space-related applications, such as the GLOWS photometer [35]. In future work, the use of setup can be extended to characterise additional gases and evaluate various optical coatings and filters relevant to space instruments and missions. The use of more sensitive VUV detectors will enable more accurate photon-number determination, especially for low-Z gases that emit VUV radiation in narrow spectral lines. These improvements may expand the applicability of the described source in future space-related calibration tasks.
Authors’ statement
Research concept and design: M.W., P.W., A.B., H.F.; collection and/or assembly of data: M.W., T.F., A.B., Ł.W.; data analysis and interpretation: M.W., P.W., A.B.; manuscript writing: M.W., P.W.; critical revision of the manuscript: P.W., A.B., M.B., M.S., H.F.; final approval of the manuscript: M.W., P.W.; and scientific consultation and cooperation on measurements of GLOWS photometer optical elements: M.B., M.S., R.W., J.M.
Acknowledgements
The research at MUT was funded and supported by the “Lasers4EU – European Laser Research Infrastructures serving Science and Industry” project (Grant agreement ID: 101131771) and the University Research Grant 773-2024. The authors from CBK PAN were supported by the Polish Ministry for Education and Science under Contract No. MEiN/2021/2/DIR.
References
[1] ISO International Standard 21348. Space environment (natural and artificial) – Process for determining solar irradiances. (2007). https://cdn.standards.iteh.ai/samples/39911/7088f5099b2343c3810f06b6ca9bc35b/ISO-21348-2007.pdf
[2] Beckman, J. E. Ultraviolet Astronomy. in Multimessenger Astronomy 117–143 (Springer Nature Switzerland AG, 2021). https://doi.org/10.1007/978-3-030-68372-6_4
[3] Linsky, J. L. UV astronomy throughout the ages: A historical perspective. Astrophys. Space Sci. 363, 101 (2018). https://doi.org/10.1007/s10509-018-3319-9
[4] Wallis, M. K. Local hydrogen gas and the background Lymanalpha pattern. Mon. Not. R. Astron. Soc. 167, 103–119 (1974). https://doi.org/10.1093/mnras/167.1.103
[5] Fahr, H. J. The extraterrestrial UV-background and the nearby interstellar medium. Space Sci. Rev. 15, 483–540 (1974). https://doi.org/10.1007/BF00178217
[6] Guinan, E. F., Ribas, I. F. & Harper, G. M. Far-ultraviolet emissions of the Sun in time: Probing solar magnetic activity and effects on evolution of paleoplanetary atmospheres. Astrophys. J. 594, 561–572 (2003). https://doi.org/10.1086/376859
[7] Zhang, Y., Paxton, L. J. & Kil, H. Solar flare impact on FUV based thermospheric O/N2 estimation. J. Atmos. Sol.-Terr. Phys. 147, 37–40 (2016). https://doi.org/10.1016/j.jastp.2016.06.014
[8] Laming, J. et al. Element abundances: A new diagnostic for the solar wind. Astrophys. J. 879, 124 (2019). https://doi.org/10.3847/1538-4357/ab23f1
[9] Witstok, J. et al. Witnessing the onset of reionization through Lyman-α emission at redshift 13. Nature 639, 897–901 (2025). https://doi.org/10.1038/s41586-025-08779-5
[10] Bzowski, M. et al. GLObal solar wind structure (GLOWS). Space Sci. Rev. 221, 105 (2025). https://doi.org/10.1007/s11214-025-01233-y
[11] McComas, D. J. et al. Interstellar mapping and acceleration probe: The NASA IMAP mission. Space Sci. Rev. 221, 100 (2025). https://doi.org/10.1007/s11214-025-01224-z
[12] Strumik, M., Bzowski, M. & Kubiak, M. A. Effects of heliolatitudinal anisotropy of solar far-ultraviolet/extremeultraviolet emissions on Ly α helioglow. Astrophys. J. 962, 45 (2024). https://doi.org/10.3847/1538-4357/ad1884
[13] Halavanau, A. et al. Experimental setup for high-resolution characterization of crystal optics for coherent X-ray beam applications. J. Appl. Crystallogr. 56, 155–159 (2023). https://doi.org/10.1107/S1600576722010998
[14] Vest, R. E. et al. NIST VUV metrology programs to support spacebased research. Adv. Space Res. 37, 283–296 (2006). - https://doi.org/10.1016/j.asr.2005.02.073
[15] Scholze, F. et al. High-accuracy EUV metrology of PTB using synchrotron radiation. Proc. SPIE 4344, Metrology, Inspection, and Process Control for Microlithography XV (2001). https://doi.org/10.1117/12.436766
[16] Hignette, O., Freund, A. K. & Chinchio, E. Incoherent X-ray mirror surface metrology. Proc. SPIE 3152, Materials, Manufacturing, and Measurement for Synchrotron Radiation Mirrors (1997). https://doi.org/10.1117/12.295559
[17] Winters, G. S. et al. The Southwest Research Institute ultraviolet reflectance chamber (SwURC): A far ultraviolet reflectometer. Proc. SPIE 8495, 84950N (2012). https://doi.org/10.1117/12.930184
[18] Wachulak, P. W., Marconi, M. C., Bartels, R. A., Menoni, C. S. & Rocca, J. J. Volume extreme ultraviolet holographic imaging with numerical optical sectioning. Opt. Express 15, 10622–10628 (2007). https://doi.org/10.1364/OE.15.010622
[19] Strumik, M. et al. Reflectance properties of the Acktar Magic Black™ coating for the radiation near the Lyman-α line of hydrogen: Measurements and phenomenological model of the BRDF. J. Astron. Telesc. Instrum. Syst. 10, 018004 (2024). https://doi.org/10.1117/1.JATIS.10.1.018004
[20] Di Palma, T. M. & Borghese, A. Characterization of a UV–VUV light source based on a gas-target ns-laser-produced plasma. Nucl. Instrum. Methods Phys. Res. Sec. B 254, 193–199 (2007). https://doi.org/10.1016/j.nimb.2006.11.059
[21] Borghese, A. & Di Palma, T. M. Laser-plasma-based vacuumultraviolet light source for tunable single-photon ionization. Appl. Opt. 46, 4948–4953 (2007). https://doi.org/10.1364/AO.46.004948
[22] Laporte, P., Damany, N. & Damany, H. Pulsed-laser-generated rare-gas plasma as a light source in the vacuum ultraviolet. Opt. Lett. 12, 987–989 (1987). https://doi.org/10.1364/OL.12.000987
[23] Masnavi, M. & Richardson, M. Spectroscopic studies of laserbased far-ultraviolet plasma light source. Appl. Sci. 11, 6919 (2021). https://doi.org/10.3390/app11156919
[24] Tock, J. P., Collette, J.-P. & Stockman, Y. Calibration and upgrades of the XMM vertical EUV/X test facility: FOCAL X. Proc. SPIE 3114, EUV, X-Ray, and Gamma-Ray Instrumentation for Astronomy VIII (1997). https://doi.org/10.1117/12.278904
[25] Fiedorowicz, H., Bartnik, A., Jarocki, R. & Szczurek, M. Enhanced X-ray emission in the 1-keV range from a laser-irradiated gas puff target produced using the double-nozzle setup. Appl. Phys. B 70, 305–308 (2000). https://doi.org/10.1007/s003400050050
[26] Fiedorowicz, H. et al. Strong extreme ultraviolet emission from a double-stream xenon/helium gas puff target irradiated with a Nd:YAG laser. Opt. Commun. 184, 161–167 (2000). https://doi.org/10.1016/S0030-4018(00)00946-9
[27] Liu, J.-H., Lu, J.-Z., Lei, J.-J., Gao, H. & Lin, J.-Q. Effect of ambient gas pressure on characteristics of air plasma induced by nanosecond laser. Acta Phys. Sin. 69, 057401 (2020). https://doi.org/10.7498/aps.69.20191540
[28] NIST Atomic Spectra Database (ver. 5.12). National Institute of Standards and Technology (NIST) https://physics.nist.gov/asd (2023). (accessed 07.31.2025)
[29] UVFS transmission data. EKSMA Optics https://eksmaoptics.com/optical-components/laser-windows/flatround-windows/ (2025). (accessed 07.31.2025)
[30] LiF data. Crystran https://www.crystran.com/opticalmaterials/lithium-fluoride-lif (2025). (accessed 07.31.2025)
[31] IRD UV Photodiodes Absolute UV Silicon Photodiodes – AXUV Series. Optodiode Corp. https://optodiode.com/review/pdf/1.%20IRD%20Photodiodes%20%20AXUV%20Operating%20Principles%20and%20Apps.pdf (accessed 07.31.2025).
[32] VUV-UV Neutral Density Filters. Teledyne Acton Optics https://www.actonoptics.com/en-us/products/vuv-uv-neutraldensity-filters (accessed 07.31.2025).
[33] Wardzińska, M. et al. Transmission Measurements of Neutral Density ACTON Filters for the GLOWS Photometer (IMAP NASA Space Mission). Poster presentation at International Conference on Space Optics (ICSO) (SPIE, 2024).
[34] Torrisi, A. et al. A stand-alone compact EUV microscope based on gas-puff target source. J. Microsc. 265, 251–260 (2017). https://doi.org/10.1111/jmi.12494
[35] Bzowski, M., Wawrzaszek, R., Strumik, M. et al. GLObal solar wind structure (GLOWS). Space Sci. Rev. 221, 105 (2025). https://doi.org/10.1007/s11214-025-01233-y